B M B 400
Part
Four: Gene Regulation
Section
III = Chapter 17
TRANSCRIPTIONAL REGULATION IN BACTERIOPHAGE LAMBDA
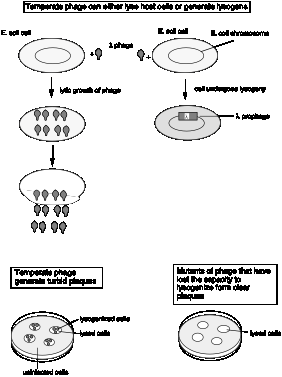
Not all bacteriophage lyse their host bacteria upon infection. Temperate phage reside in the host genome and do not kill the host, whereas lytic phage cause lysis of their hosts when they infect bacteria. The bacteriophage l can choose between these two “lifestyles.” The molecular basis for this decision is one of the best understood genetic switches that has been studied, and it provides a fundamental paradigm for such molecular switches in developmental biology.
This chapter reviews some of the historical observations on lysogeny in bacteriophage l, covers the major events in lysis and lysogeny, and discusses the principal regulatory proteins and their competition for overlapping cis-regulatory sites. We will examine one of the common DNA binding domains in regulatory proteins – the helix-turn-helix, which was first identified in the l Cro protein. Also, the use of hybrid genes to dissect complex regulatory schemes was pioneered in studies of bacteriophage l, and that approach will be discussed in this chapter.
A. Lysis versus lysogeny
1. Lytic pathway:
a. Leads to many progeny virus particles and lysis of the infected cell.
b. Have extensive replication of l DNA, formation of the viral coat (head and tail proteins) with packaging of the l DNA into phage particles, cell lysis, and release of many progeny phage.
2. Lysogenic pathway:
a. The infecting phage DNA integrates into the host genome and is carried passively by the host.
b. Have repression of l lytic functions, integration of l DNA into the host chromosome (at the att site). The bacterial cell carrying the integrated prophage is called a lysogen; the l DNA is replicated passively along with the E. coli genome. The host cell is not killed, and is immune to further infection by l phage.
3. Early Observations on Lysogeny
Lysogeny is the hereditary ability of a bacterium to produce phage.
Bacteriophage that can bring about the lysogenic state in bacteria are called temperate phage; those that only lyse cells are called virulent.
Studies on lysogeny started in the 1920's and continued through the 1940's, particularly from the laboratories of Eugene and Elizabeth Wollman and Andre Lwoff, examining a lysogenic strain of Bacillus megaterium. This system was particularly amenable to studies of lysogeny because an indicator strain was available, i.e. a related, nonlysogenic strain that is sensitive to the phage produced by the lysogenic strain upon induction, and because the cells of B. megaterium are very large and could be isolated as single cells by micromanipulation.
Examination of single cells, and other studies, showed that:
[1] All cells of a lysogenic culture are lysogens.
[2] The lysogenic character persists after repeated passage of a culture through an antiserum specific for the phage, i.e. no free phage are required to maintain the lysogenic state.
[3] Lysogenic bacteria can adsorb the phage they produce, but they are not infected - they are immune to the phage.
[4] After the phage infect a sensitive host, one can isolate bacteria resistant to the phage which can now produce phage identical to the original (i.e. infection of a sensitive host leads to the formation of new lysogens).
Figure 4.3.1.
The specific hereditary structure within lysogens needed for the production of phage was called a prophage.
In contrast to the random spontaneous lysis of a small fraction of lysogens (e.g. about 1/1000), Lwoff discovered by irradiation with UV would induce lysis of virtually all bacteria in a culture of lysogens.
Three basic phenomena were discovered:
¨ Lysogeny: hereditary ability to produce phage
¨ Induction: stimulation of lysis of a whole population of lysogens
¨ Immunity (or resistance): lysogens are resistant to superinfection with the phage produced by the lysogen.
Figure 4.3.2
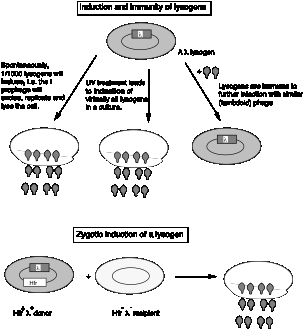
Lysogeny in E. coli: zygotic induction (about 1951)
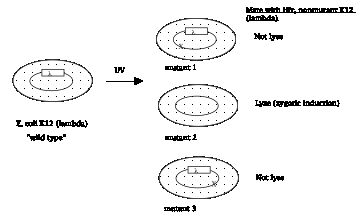
Joshua and Esther Lederberg, studying conjugation, worked with E. coli strain K12 for many years without realizing that it was a l lysogen. They had no indicator strain to reveal the presence of l as a prophage. In describing these experiments, I will refer to the original strain as K12(l) to denote its lysogenic state, even though it was not recognized as such until after these experiments.
Some UV-generated mutants of K12(l) showed an unusual behavior referred to as zygotic induction. Although these mutants would grow normally in culture, when used as recipients in conjugation experiments with male (Hfr) strains of wild-type K12(l) as the donor, the cells would lyse!
Figure 4.3.3. Zygotic induction
E. Lederberg called the phage released by induction of E. coli K12(l) lambda, or l, since it was found just after the k factor from Paramecium.
Infection of the l-sensitive strain E. coli C with l produced turbid plaques. Most infected cells did lyse, but some lysogenized, generating colonies of l-resistant cells in the midst of an otherwise clear area, i.e. turbid plaques.
Conclusions from these and other experiments:
[1] The original E. coli K12 was a l lysogen [i.e. K12(l)]. It carried a l prophage, integrated into the E. coli chromosome (at att l). The prophage confers the heritable ability to produce l, i.e. lysogenicity.
[2] Lysis can be induced, either
spontaneously (about 1 in 1000 lysogens) or
by UV induction (essentially all lysogens).
Induction requires recA+.
[3] Lysogens are immune to further infection by the same phage. Other lambdoid phage can infect, e.g. l lysogens can be infected by phage 434.
[4] Some of the mutants of E. coli K12(l) had lost the l prophage, and hence they are not longer lysogens (Fig. 4.3.2, mutant 2). When the l prophage is donated to these nonlysogenic recipients by conjugation, zygotic induction occurs. That is, the l prophage in the Hfr strain is induced when it enters the nonlysogenic strain. This indicates that some negative factor is present in the lysogen that is absent in the nonlysogen that prevents induction. (Alternatively, the converse is possible - a positive factor present in the nonlysogen. But as we will see later, the negative factor, or l repressor, is present in the lysogen and prevents lysis).
4. Regulatory mutants of l
a. Clear plaque mutants (Dale Kaiser, 1957)
wt required for establishment wt required for maintenance
of lysogeny of lysogeny
cI yes yes
cII yes no
cIII yes no
Act in trans
b. virulent (or vir): lyse host cells, do not lysogenize
Act in cis, are double mutants in oR and/or oL.
B. Map of l
Figure 4.3.4.
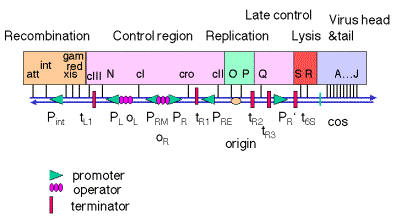
1. DNA from a l phage particle is linear, but the ends are complementary cohesive ends (cos). Thus when the phage DNA is injected into a cell upon infection, the ends anneal to form a circle. Maps of l DNA are frequently drawn from the left cos site to the right one, but the map in Fig. 4.3.4 is the linear map l opened at the att site. This presentation shows the clustering of functions on the genome. The map is not to scale.
2. Genetic functions are clustered in l, including both trans-acting proteins and cis-acting sites
a. Control region
(1) Control at PR, PL and PRM:
cI encodes the repressor that turns off lytic functions.
cro encodes the "antirepressor" that turns off the repressor
Both of these act at operators OR and OL that control promoters PR, PL and PRM
Note the proximity between the genes and the sites at which the gene product acts.
(2) Control at PRE :
cII encodes a positive regulator of transcription at PRE .
cIII encodes a protein that is needed to stabilize the product of cII .
(3) N is an antiterminator that allows trancriptional read-through at tL1, tR1 and tR2.
b. Replication
O and P encode proteins required to initiate replication. The product of O is analogous to DnaA, forming a complex at the origin of replication, which is within the coding region of O . The P protein brings in DnaB to the origin, to initiate replication in a mechanism similar to that at oriC.
c. Late control
The product of Q is an antiterminator that prevents termination at t6S , which is just downstream of the Q gene.
d. Recombination
(1) The product of the int gene is required for integration into the host chromosome, using the att (attachment) site that is adjacent to int. The products of the xis and int genes are required for excision of the prophage, again using the adjacent att site.
(2) The products of red and gam (gamma) are needed to convert from q-form replication to rolling circle during the viral replication pathway.
e. Late genes
The products of several genes (A through J) are the protein components of the viral head and tail, needed for make phage particles.
f. Nonessential region
The b2 region (named for a large deletion that leaves the phage still viable) is not needed. This is a substantial part of the region that is replaced when l is used as a cloning vector.
C. Lytic cascade
1. Early, delayed early and late
genes
a. Early genes are expressed before DNA replication initiates.
(1) Immediate early genes are transcribed by the host RNA polymerase, and include regulator(s) that are needed for the next set of genes to be expressed.
(2) Delayed early genes include replication proteins, and need an immediate early regulator to be expressed. The delayed early genes make a regulator required for late gene expression.
b. Late genes are expressed after DNA replication initiates.
These include structural genes for the viral coat and enzymes for cell lysis.
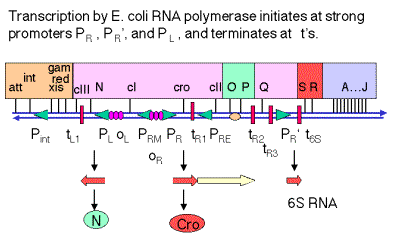
Figure 4.3.5. Transcription and translation of
immediate early genes.
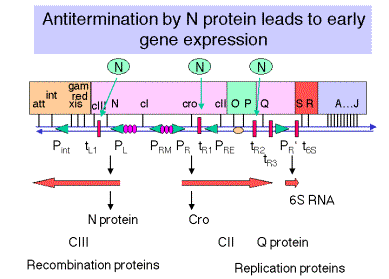
2. N encodes an antiterminator
a. Immediately after infection, the first promoters that are active are PL, PR and PR'. These are transcribed by E. coli RNA polymerase with no need for other (l) proteins. The sequences of these promoters are close matches to the consensus for -10 and -35 boxes.
b. N is the first gene transcribed from PL, from which RNA polymerase transcribes in a leftward direction.
c. The product of N, called pN or N protein, prevents RNA polymerase from stopping at the r-dependent terminators tL1 (leftward transcription from PL) and tR1 and tR2 (rightward transcription from PR).
3. Cro antirepressor
a. cro is the first gene transcribed from PR, from which RNA polymerase transcribes in a rightward direction.
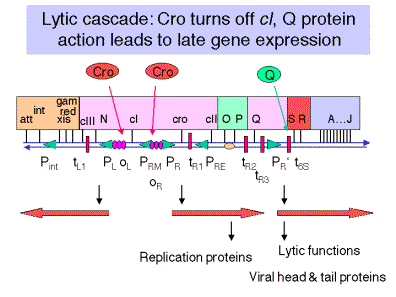
b. Early in the infection, the protein Cro binds to OR3 to prevent transcription from PRM (the promoter for repressor maintenance). Hence it acts against the repressor, so it is called the antirepressor, and it helps prevent lysogeny.
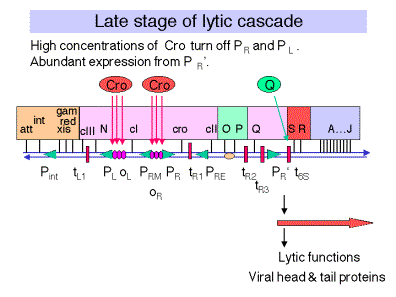
c. As the [Cro] increases later in the infection, it also binds to the other sites in the leftward and rightward operators to turn off immediate early transcription, after the products of these genes are no longer needed.
Fig. 4.3.7.
4. Products of leftward
transcription: recombination and integration
a. Action of pN at tL1 allows read-through transcription of red and gam, which are required for a recombination event during replication, so they are involved in lysis.
b. The cIII gene, which is required for lysogeny, is also transcribed as a result of the lack of termination at tL1.
c. The int and xis genes are also transcribed, but this read-through transcription extends past the r-dependent terminator tint (because of antitermination by N protein). Transcripts that extend into the b2 region form a secondary structure that is recognized by an RNase, which degrades the transcript from the 3' end, thereby removing int from the transcript.
5. Products of rightward
transcription: replication and Q
a. Action of pN at tR1 allows readthrough transcription of the O and P genes required for replication initiation (as well as cII required for lysogeny).
b. Action of pN at tR2 allows further readthrough transcription of the Q gene.
6. The protein pQ is also an
antiterminator
a. Acts on transcription initiating at PR' to prevent termination at t6S .
b. Allows expression of late genes (S and R for lysis; A through J for head and tail proteins).
c. Expression of Q commits the infected cell to the lytic pathway.
Fig. 4.3.8
D. Lysogeny
1. Requires repressor (product of cI gene) and operators
Repressor binds at OL and OR to block transcription from PL and PR
2. Mutational analysis
a. Clear plaque mutations: cI, cII, cIII
trans-acting; required to make repressor. No lysogeny in these mutants.
b. cis-acting vir mutations. No lysogeny in these mutants.
Sites OR1, OR2, OL1 and OL2 in the operators are altered to prevent binding of repressor in vir mutants.
3. cII and cIII genes encode positive regulators of PRE and Pint
a. The pattern of expression of immediate early and delayed early genes in the lysogenic pathway is quite similar to that of the lytic pathway.
b. After pN allows read-through transcription past tR1 and tL1, the genes cII and cIII are expressed.
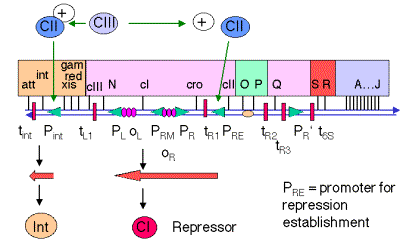
c. PRE is the promoter for repression establishment, and is not transcribed well by RNA polymerase alone. The -10 and -35 boxes are very poor matches to the consensus for E. coli promoters. The protein product of the cII gene will enhance the binding of RNA polymerase to PRE and hence stimulate initiation of transcription from this promoter.
d. The cII product is an unstable protein. A protease encoded by the hflA gene on the E. coli chromosome will degrade the cII protein. Mutations in hflA cause a high frequency of lysogeny (do you see why?), hence the acronym for its name. The l protein encoded by the cIII gene will interfere with degradation of the cII protein by HflA.
e. Once transcription initiates at PRE, the RNA polymerase will continue leftward and transcribe through the cI gene, thus beginning the expression of the l repressor.
f. The cII protein is also an activator of transcription from Pint, the promoter for the integrase gene. Production of integrase allows it to catalyze the integration of the l genome into the E. coli chromosome. This occurs by site-specific recombination between the att site on l and the latt site on the E. coli chromosome.
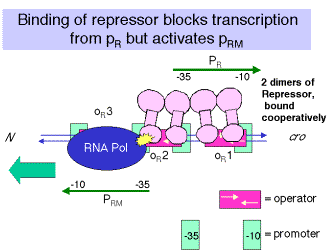
4. Binding of repressor to
operators
a. Binding to OL1 and OL2 blocks leftward transcription from PL, and binding to OR1 and OR2 blocks rightward transcription from PR.
This turns off transcription of the genes required for phage multiplication and cell lysis. Thus occupancy of the operators by repressor commits the infected cell to lysogeny.
Fig. 4.3.10.
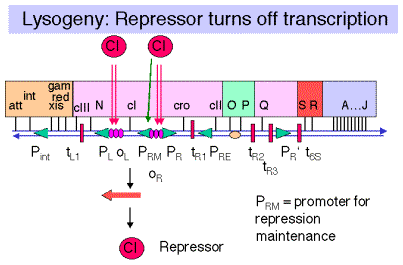
b. Binding to OR1 and OR2 also enhances transcription from PRM.
PRM is the promoter for repressor maintenance. It is adjacent to PR and directs transcription leftward through cI. After lysogeny, the concentration of repressor in the cell will decrease as the cells multiply. Transcription from PRM allows the [repressor] to be maintained at an adequate level to prevent transcription from PR and PL.
Table 4.3.1. Gene Products and Sites Involved in the Different Pathways of l: Lysis or Lysogeny
|
Lysis |
Lysogeny |
Both |
|
Cro represses cI Repressor |
cI, cII, cIII establish lysogeny |
N antiterminator |
|
O, P, Red, Gam replication |
cI Repressor maintains lysogeny |
|
|
Q antiterminator |
Int integrates l DNA |
|
|
S, R lysis |
Xis (with Int) excises l prophage |
|
|
A through J are head and tail proteins |
|
|
|
PR' |
PRE, Pint, PRM
|
PL, PR |
|
|
|
oL, oR |
|
qut |
att |
nut |
|
tR2 , t6S |
tint |
tL1, tR1 |
|
oril |
|
|
|
|
|
|
E. Operator structure
1. 3 binding sites
a. OL1 and OL2 and OL3 comprise OL
b. OR1 and OR2 and OR3 comprise OR
2. Dyad symmetry
a. Each of the binding sites is 17 bp with an imperfect dyad centered on the 9th bp.
b. Although the sequences are similar to each other, they are not identical, and as we will see shortly, the affinitites of repressor and Cro differ for each site.
Figure
4.3.11. l operators
overlap with promoters
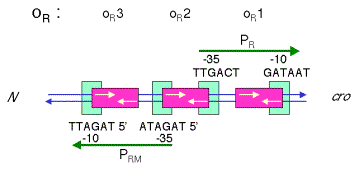
3. These operators overlap the
promoters
a. OR1 and OR2 overlap with the -10 and -35 boxes, respectively, of PR. Binding of repressor to these sites should block access of RNA polymerase to these sites. {Note that this is the steric interference model again. Even though we saw with lac that this model does not hold, the lac operator is centered at +10, and polymerase can bind even when lac repressor is bound. However, for OR, as well as for OL, the repressor and polymerase are in direct competition for the same sites.}
b. Similarly, OL1 and OL2 overlap with the -10 and -35 boxes, respectively, of PL. Binding of repressor to these sites should block access of RNA polymerase to these sites.
c. OR3 overlaps PRM, so when Cro binds to this site, transcription from PRM is blocked.
Figure 4.3.12. Affinities of Repressor and Cro for l operators

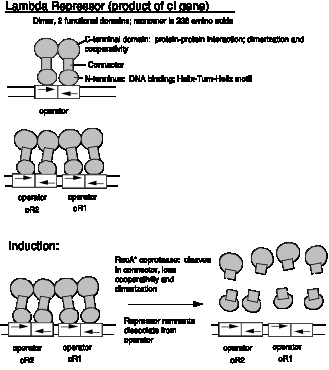
F. Repressor protein
1. Protein structure
a. Functions as a dimer, each monomer of which is 236 amino acids in sequence.
Note the symmetrical protein binding to a dyad motif in the DNA. One monomer binds to one half-site of the dyad binding site, e.g. a dimer binds to OR1.
b. The monomers have an N-terminal DNA binding domain (amino acids 1-92), a connector, and a C-terminal protein interaction domain (for dimerization).
A web tutorial on lambda cro and repressor binding to DNA is at
http://www.bimcore.emory.edu/home/Kins/bimcoretutorials/Mrobbin/protein-dnamod/left.html
Figure 4.3.13.
2. DNA binding domain:
helix-turn-helix
a. The structure of co-crystals between the N-terminal domain of l repressor and the DNA binding sites has been determined by X-ray crystallography. Similar data are available for co-crystals of Cro protein and operator DNA.
b. The N-terminal domain of l repressor consists of an N-terminal arm and five a-helices. One a-helix (helix 3 in the structure) is in the major groove contacting several of the bases in the operator half-site. The N-terminal portion of helix 3 makes contacts with bases in the major groove.
c. Helix 2 is perpendicular to helix 3, connected by a short turn of amino acids, hence the designation of this structural motif as helix-turn-helix (HTH). Helix 2 lies astride the phosphodiester backbone and makes specific contacts with it.
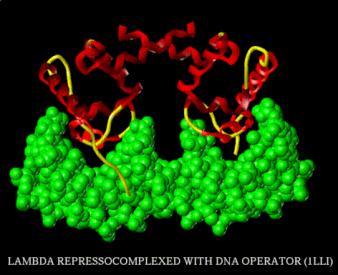
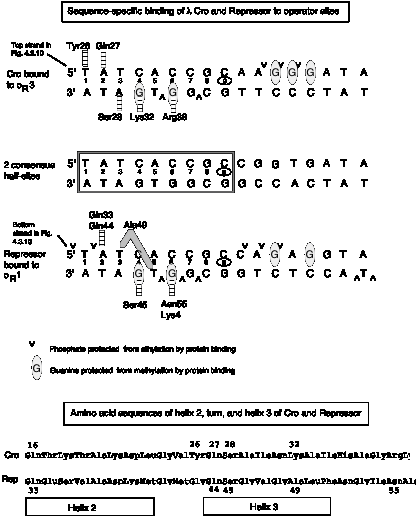
Figure 4.3.14.
From http://www.rtc.riken.go.jp/jouhou/image/dna-protein/all/small_N1lli.gif
d. The glutamine at the N-terminal of helix 3 makes two specific H-bonds with the edge of an adenine in the major groove. The next serine in the sequence can either form two H-bonds with a G at position 4 (for l repressor) or an A at position 3 of the operator (for Cro). An amino acid needs to provide both a donor and acceptor of H-bonds to form 2 H-bonds with adenine. In contrast, a guanine can form 2 H-bonds with an amino acid, such as arginine, that provides two H-bond donors. Although interactions such as these are seen commonly for sequence-specific binding in the major groove, there is no simple code of amino acids bonding to nucleotides for this structural motif. This is well illustrated by the example of the serine just discussed. In this case, the same amino acid at an equivalent position in the protein will interact with different nucleotides, depending on whether it is in the l repressor or in Cro.
e. Networks of interactions play important roles in determining the specificity of proteins binding to DNA. The combination of interactions at the different half-sites probably contributes to the different affinities, e.g. l repressor binding much more avidly to oR1 than to oR3.
Figure 4.3.15
![]()
![]()
3. Protein interaction domain
The C-terminal domain is required for dimerization between 2 monomers. The two HTH motifs in the dimer fit nicely into adjacent major groove in the DNA, i.e. the two half-sites of the l operator.
4. Differential affinities for
operators
a. Repressor binds with greatest affinity to OR1, then with 10-fold less affinity for OR2 . The affinity for OR3 is quite low.
b. Repressor has similar differential
affinities at OL.
5. Cooperativity
a. Once a repressor dimer binds to OR1, it facilitates subsequent binding of an additional repressor dimer to OR2 , so in fact this cooperativity means that both OR1 and OR2 are occupied when repressor is expressed.
b. This prevents transcription from PR.
c. Similar cooperativity occurs at OL1 and OL2 to turn off transcription from PL.
d. The same C-terminal domain that is needed for dimerization is also needed for interactions between dimers to produce the cooperativity.
Figure 4.3.16.
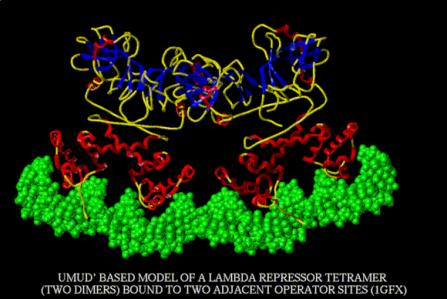
This is a model of the interaction of two dimers interacting cooperatively at two adjacent operator sites. From
http://www.rtc.riken.go.jp/jouhou/image/dna-protein/all/small_N1gfx.gif
6. Activation of transcription at PRM
a. Positive control mutations of the l repressor map to positions on helix 2, on the face away from the DNA.
b. An aspartate, serine, and glutamate comprise an acidic surface that is required to stimulate transcription by RNA polymerase from PRM.
c. This is most likely a direct interaction between RNA polymerase and this part of helix 2.
d. Subsequently, several more examples of acidic sequences serving as activators of transcription have been discovered, e.g. GAL4 in yeast, VP16 in mammalian cells infected with Herpes virus.
G. Cro protein
1. Mutations in cro lead to a higher frequency of lysogeny.
Cro is needed for lytic infection. It blocks expression of the repressor and in fact competes with it for the same operators.
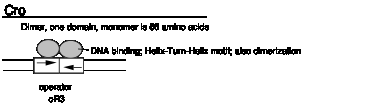
2. Small protein, only 66 amino acids, that functions as a dimer.
It still has a DNA binding domain and a dimerization domain. The crystal structure shows that the Cro monomer consists of three anti-parallel b-sheets and three a-helices. The Cro dimer is stabilized by pairing between Glu54-Val55-Lys56 from each monomer in the b-sheet region. This provides two electrostatic interactions (the negatively charged Glu with the positively charged Lys) and one hydrophobic interaction.
3. DNA binding domain:
helix-turn-helix
The 3-D structure of the HTH is similar to that of l repressor, and the overall interactions are similar; i.e. helix 3 in the major groove with helix 2 above it and alongside the phosphodiester backbone.
4. Affinities for operators: opposite to those of repressor
a. Cro binds with highest affinity to OR3 and to OL3. This turns off PRM, thus blocking production of l repressor. Binding to OL3 has little effect on PL.
b. At higher [Cro], it will also bind to OR1 and OR2, as well as OL1 and OL2, thus turning off transcription from both PR and PL. At later stages of the lytic infection, early gene expression is not needed, only late trascription from PR', with transcription reading through the t6s terminator to allow expression of S, R, and A through J.
c. The amino acid sequence in the HTH region differs in some residues from that of the repressor, and the actual contacts in the major groove differ from repressor-operator interactions in some cases. This gives Cro a different affinity for these operator sites, in fact the opposite affinities, compared to repressor.
5. Competition between repressor and Cro for the same sites will determine the decision between lysis and lysogeny.
H. Use of hybrid reporter genes to dissect regulatory schemes
1. Although the genetic analysis has resolved different regions in the operator, it was necessary to design an artificial system to test the effects of each region individually. This can be done conveniently with hybrid reporter genes.
2. Ptashne and his colleagues decided to let the promoter/operator regions of l regulate expression of the lacZ gene in an E. coli strain.
a. The activity of the enzyme encoded by the lacZ gene, b-galactosidase, can be measured quickly and accurately with high sensitivity. In this case, lacZ is the reporter gene.
b. Other examples of reporter genes in widespread use are those encoding b-glucuronidase, chloramphenicol acetyl transferase, and luciferase.
3. The production of either
repressor or Cro can be regulated by driving expression of cI or cro with the lac promoter/operator in a cell that has wild-type lacI, i.e. that has the lac repressor.
Figure 4.3.18.
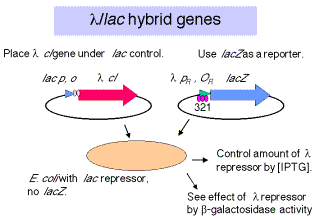
a. This allows one to use IPTG to induce expression of the desired l regulatory protein.
b. In eukaryotic cells, one would use an appropriate regulated promoter, e.g. a heat shock promoter, or a hormonally inducible promoter (e.g. MMTV promoter, which is activated by glucocorticoids).
4. A few illustrative results
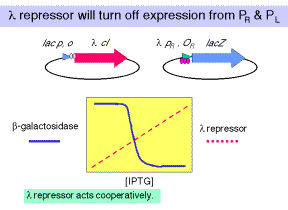
a. Consider an E. coli strain carrying two plasmids. The lacZ reporter is driven by wild-type l PR/OR, and the l cI gene is driven by the lac promoter/operator.
(1) Increasing concentrations of the repressor (generated by increasing [IPTG]) cause a cooperative decrease in b-galactosidase activity.
(2) One concludes that l repressor will turn off expression from PR, in a cooperative manner.
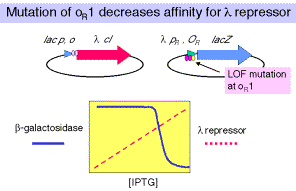
b. In a similar strain, except that OR1 has been mutated, one sees that a higher [repressor] is needed to turn off expression from l PR.
One concludes that OR1 has the highest affinity for the repressor, and that the remaining two sites will still show cooperativity in binding repressor. They just need a higher [l repressor] to bind.
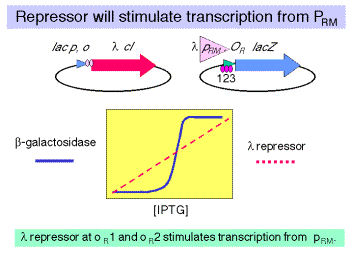
c. Consider a strain carrying the same regulator construct (l cI driven by lac p,o), but the lacZ reporter gene is driven by the l PR/OR fragment in the reverse orientation. In this case, the reporter gene is driven by PRM.
(1) In this case the increasing [l repressor] causes an increase in b-galactosidase activity. Although it is not shown in this figure, as the [l repressor] increases further, the amount of b-galactosidase now decreases.
(2) One concludes that the l repressor can activate transcription from PRM at low concentrations but represss at higher concentrations. By testing mutants of the individual operator sites, singly and in combination, one can show that it is occupancy of OR1 and OR2 that stimulates transcription from PRM, but occupancy of OR3 will turn off transcription.
5. The cro gene was placed under control of lac p,o to test the effects of Cro on these same constructs. The results showed the opposite affinities for operator sites, as discussed previously.
I. Decision between lysis and lysogeny
1. The initial pathways for both lysis and lysogeny are identical - expression of immediate early and delayed early genes via production of pN. All the players needed for the "committed" steps for each pathway are present.
2. The competition between repressor and Cro for sites in the leftward and rightward operators will be key determinants in the decision betwen the two pathways.
3. The [CII] (i.e. the concentration of the product of the cII gene) will in turn determine the initial [repressor] by its stimulation of transcription from PRE.
4. Two environmental factors will cause an increase in [CII] and thereby favor lysogeny.
a. A high multiplicity of infection (MOI) will generate more CII because there are more templates producing it.
(1) The MOI is just the ratio between infecting phage particles and host cells. At an MOI>10, the [CII] is high enough to favor lysogeny.
(2) In a way, the phage are sensing that it is too crowded, and they are better off just being carried along with the bacterium as the prophage of the lysogen.
b. When E. coli is starving (poor medium), the [glucose] is low, and the [cAMP] increases.
(1) The increase in [cAMP] will repress expression of the hflA, so that the [CII] will be higher and lysogeny will be favored.
(2) Again, the environment is not favorable for a lytic infection, and the phage lysogenizes the host.
5. Genetic factors:
E.g.: hflA- mutations cause a high frequency of lysogeny.
J. Induction of lysogenic prophage
1. When SOS functions are induced (recall this pathway from the section on DNA repair), RecA converts to an activated conformation, RecA*, a co-protease.
2. Just as RecA* activates the protease activity in LexA, it also activates a protease in the l repressor, which cleaves the connector region between the N and C terminal domains of repressor. See Figure 4.3.13.
3. The loss of the dimerization domain of the repressor leaves only the DNA binding domains. Their affinity for the operator sites is substantially less than that of the intact repressor, and they dissociate.
4. This leaves the operator sites empty, and transcription can begin from PR and PL, thus starting the lytic cascade. The activity of RecA* will keep the [intact repressor] low, and the induced prophage will proceed along the pathway to lysis.
Questions on
Chapter 17. Transcriptional regulation in bacteriophage lambda
17.1 (POB) Bacteriophage l
Bacteria that become lysogenic for bacteriophage l are immune to subsequent l lytic infections. Why?
17.2 l cro protein
1) binds preferentially to OR3.
2) turns off transcription from PRM.
3) binds to OR1 and OR2 at high concentration to turn off transcription from PR (and from PL by analogous activity at OL).
Which of the above statement(s) is (are) correct?
17.3 The l mutants cI ‑ and cII ‑ produce no lysogens, so they make clear plaques. If they are coinfected into E. coli, will they produce turbid plaques, and if so which phage will be found in the resulting lysogen?
Occupancy of the l operator by repressor and Cro (next 5 problems)
{This gives you some practice with the equations and analyses in Chapter 16, and hopefully provides some insights into the competitions of repressor and Cro as well as the effects of cooperativity. These questions are based on a discussion in Appendix One of M. Ptashne's book A Genetic Switch: Gene Control and Phage l}
Let's imagine a stage after infection of E. coli with l where there are 100 molecules of Cro dimer per cell and 100 molecules of l repressor dimer per cell. The l phage has not yet replicated, so there is one copy of the l genome per cell. These problems were designed and answered when the estimate of the E. coli genome was about 4.2 x 10⁶ bp; you can use the value of 4.6 ´106 if you wish. Assume that there is only one genome per cell. The volume of the cell is 1 x 10-15 L.
Binding of the l repressor to an operator (a specific site) or a nonspecific site is described by the following equations. Similar equations apply to binding of Cro to DNA. The following values for Ks are based on binding to an operator like oR1, to which repressor has a higher affinity than does Cro.
Let R = l repressor dimer
O = l operator site
D = a nonspecific binding site in the genomic DNA
C = Cro dimer
R + O
Ks,r = = 1011 M-1 (eqn 2)
Kns,r = = 105 M-1 (eqn 3)
C + O
Ks,c = = 1010 M-1 (eqn 5)
Kns,c = = 105 M-1 (eqn 6)
17.4 If the equilibrium constant for binding of the l repressor to an operator site (call it Ks,r) is 1 x 10¹¹ M-1, and the equilibrium constant for the binding of l repressor to a nonspecific (non-operator) site on the DNA (call it Kns,r) is 1 x10⁵ M-1, what fraction of the repressor molecules are free, i.e. not bound to either the operator or any nonspecific site on DNA? For simplicity, calculate how much free repressor would be present for a l phage that had only a single operator (not the 6, each with different affinities) that are present in wild-type l.
17.5. Using the same values for Ks,r and Kns,r and the same simplification of considering a single operator site as given in the previous problem, calculate the fraction of operator sites not bound by l repressor. For this problem, ignore the effects of Cro (i.e. ignore the competing equilibria of Cro for O).
17.6. If Cro has a 10-fold lower affinity for this single operator site, but is also present at 100 dimers per cell, what fraction of the operator sites would be bound by Cro? Again, for simplicity, ignore the competing effects of l repressor.
17.7. The results from the two previous problems suggest that the l repressor would "win" in a competition with Cro for the operator, given its ability at a given concentration to fill more of the operator sites. This fits with the 10-fold higher value for Ks that we are using for repressor, compared to Cro. To take another look at this, divide eqn 2 by eqn 5 and derive an expression for [RO]/[CO]. What do you calculate for the ratio of (repressor bound to operator) to (Cro bound to operator)?
17.8. The binding of l repressor to the operator sites oR1 and oR2 (as well as oL1 and oL2) is cooperative, i.e. the binding of the first repressor dimer increases the affinity of a second repressor dimer for the adjacent site. This can be modeled quantitatively as follows. Given that repressor binds to a single site with Ks,r = 1011 M-1, that means that the free energy (DG) for binding to DNA is about -15 kcal per mole (you may recall that DG = -RT ln K). The protein-protein interactions of the repressor dimers will add a DG = -2 kcal per mole to the affinity of binding two repressors to adjacent sites, so the effects of cooperativity increases the apparent Ks,r to 3 x 10¹² M-1. How much more repressor is needed to fill 99% of the operators for non-cooperative binding than for cooperative binding to adjacent sites? Let's consider an in vitro situation where you are adding increasing amounts of repressor protein to a short DNA fragment that has the operator site; this allows you to ignore the effects of binding to nonspecific sites. Calculate the [R] at which [RO]/[O] = 99. Since in the case of cooperativity, the two adjacent sites will be filled almost simultaneously, consider these adjacent sites to be equivalent to a single (larger) binding site for repressor.