B M B 400, Part
Three
Gene Expression
and Protein Synthesis
Chapter 11. TRANSCRIPTION: PROMOTERS, TERMINATORS AND mRNA
This second chapter on transcription focusses on the cis-acting elements needed for accurate transcription, with a emphasis on promoters. The chapter begins with a discussion of techniques used to find the start site for transcription and to identify the segments of DNA bound by protein. It then covers promoters, elongation, termination, and mRNA structure. The phenomenon of polarity is explored to show the relationships among mRNA structure, transcription and translation in E. coli.
A. Mapping the 5' ends of mRNA
The nucleotide in DNA that encodes the 5' end of mRNA is almost always the start site for transcription. Thus methods to map the 5’ end of the mRNA are critical first steps in defining the promoter.
Figure 3.2.1. Nuclease protection to map 5’ end of a gene
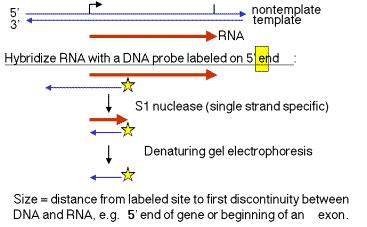
1. "S1 protection assay"
This assay measures the distance between an end label (at a specific known site on DNA) and the end of a duplex between RNA and the labeled DNA. A fragment of DNA (complementary to the RNA) that extends beyond the 5' end of the RNA is labeled at a restriction site within the RNA‑complementary region. The labeled DNA is hybridized to RNA and then digested with the single‑strand specific nuclease S1. The resulting fragment of protected DNA is run on a denaturing gel to determine its size. Note that this fragment runs from the labeled site to the nearest interruption between the DNA and the RNA. This could be the beginning of the RNA, or it could be an intron, or it could be an S1 sensitive site.
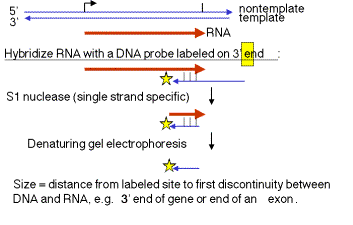
Fig. 3.2.2. Nuclease protection
assay to define the 3’ end of a gene.
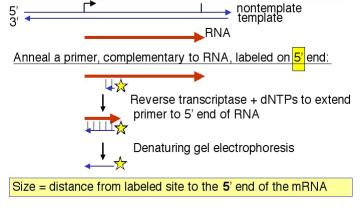
2. "Primer extension assay"
This assay measures the distance between an end label and the point to which reverse transcriptase can copy the RNA. A short fragment of DNA, complementary to RNA, shorter than the RNA and labeled at the 5' end, is hybridized to the RNA. It will now serve as a primer for synthesis of the complementary DNA by reverse transcriptase. The size of the resulting primer extension product gives the distance from the labeled site to the 5' end of the RNA (or to the nearest block to reverse transcriptase).
Fig. 3.2.3. Primer extension assay,
another way to map the 5’ ends of genes
3. How do you label DNA at the ends?
a. 5' end label: T4 polynucleotide kinase and [g 32P] ATP. The reaction is most efficient if the 5' phosphate is removed (by alkaline phosphatase) prior to the kinase treatment.
b. 3' end label: Klenow DNA polymerase plus [a 32P] dNTP. The labeled dNTP is chosen to be complementary to the first position past the primer. A restriction fragment with a 5' overhang is ideal for this "fill‑in" labeling.
c. Digestion with a second restriction endonuclease will frequently work to remove the label at the "other" end. One can also use electrophoretic gels that separate strands.
4. A PCR-based technique to determine the 5’ ends of mRNAs and genes
A technique utilizing the
high sensitivity of PCR has been developed to determine the 5’ ends of mRNAs
which can then be mapped onto genomic DNA sequences to find the 5’ ends of
genes. This technique is called rapid amplification of cDNA ends and is abbreviated RACE. When RACE is used to determine the 5’ end of mRNA,
it is called 5’ RACE. This method
requires that an artificial primer binding site be added to the 5’ ends of
copies of mRNA, or cDNA, and knowledge of a specific sequence within the cDNA,
which will serve as the second, specific primer for amplification during PCR
(Fig. 3.2.3b).
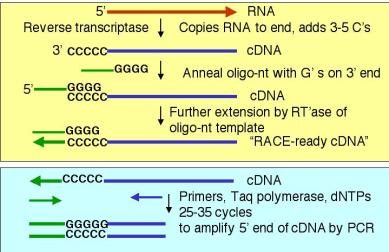
Fig. 3.2.3.b. Rapid amplification of cDNA ends, or 5’ RACE
The methods for making cDNA from mRNA are more prone to copy the 3’ ends and middle of mRNAs than the 5’ ends. Thus it is common to have access to this part of the cDNA, and that provides the sequence information for the second, or internal, primer. In contrast, specialized techniques are often employed to get information about the 5’ ends of mRNAs. In the technique outlined in Fig. 3.2.3.b, the fact that reverse transcriptase tends to add a few C residues to the 3’ end of the cDNA is used to design an artificial template that will anneal to those extra C nucleotides. Then reverse transcriptase copies the second template, thereby adding the artificial primer binding site. This artificial primer binding site is needed because the sequence of the 5’ end of the mRNA is not known in this experiment; indeed, that is what the experimenter is trying to determine. Once the artificial primer binding site has been added to the cDNA, then the modified cDNA serves as the template for PCR. The PCR product is sequenced and compared to an appropriate genomic DNA sequence. The first exon or exons of the genes will match the sequence of the PCR product, starting right after the first primer.
B. General
methods for identifying the site for sequence‑specific binding proteins
1. Does
a protein bind to a particular region?
a. Electrophoretic mobility shift assay (EMSA), or gel retardation assay
This assay will test for the ability of a particular sequence to form a complex with a protein. Many protein‑DNA complexes are sufficiently stable that they will remain together during electrophoresis through a (nondenaturing) polyacrylamide gel. A selected restriction fragment or synthetic duplex oligonucleotide is labeled (to make a probe) and mixed with a protein (or crude mixture of proteins). If the DNA fragment binds to the protein, the complex will migrate much slower in the gel than does the free probe; it moves with roughly the mobility of the bound protein. The presence of a slowly moving signal is indicative of a complex between the DNA probe and some protein(s). By incubating the probe and proteins in the presence of increasing amounts of competitor DNA fragments, one can test for specificity and even glean some information about the identity of the binding protein.
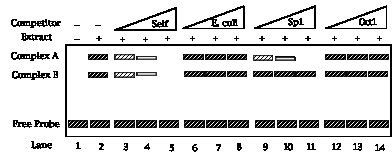
Figure 3.2.4. Diagram of results from an electrophoretic mobility shift assay
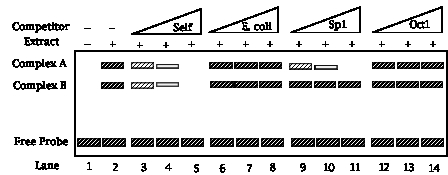
In this example, two proteins recognize sequences in the labeled probe, forming complexes A and B (lane 2). The proteins in complexes A and B recognize specific DNA sequences in the probe. This is shown by the competition assays in lanes 3-8. An excess of unlabeled oligonucleotide with the same sequence as the labeled probe (“self”) prevents formation of the complexes with labeled probe, whereas “nonspecific DNA” in the form of E. coli DNA does not compete effectively (compare lanes 6-7 with lanes 3-5).
This experiment also provides some information about the identity of the protein forming complex A. It recognizes an Sp1-binding site, as shown by the ability of an oligonucloetide with an Sp1-binding to compete for complex A, but not complex B (lanes 9-11). Hence the protein could be Sp1 or a relative of it.. The proteins forming complexes A and B do not recognize an Oct1-binding site (lanes 12-14).
b. Nitrocellulose binding
Free duplex DNA will not stick to a nitrocellulose membrane, but a protein‑DNA complex will bind.
2. To
what sequence in the probe DNA is the protein binding?
The presence of a protein will either protect a segment of DNA from attack by a nuclease or other degradative reagent, or in some cases will enhance cleavage (e.g. to an adjacent sequence that is distorted from normal B‑form). An end‑labeled DNA fragment in complex with protein is treated with a nuclease (or other cleaving reagent), and the protected fragments are resolved on a denaturing polyacrylamide gel, and their sizes measured.
a. Exonuclease protection assay
The protein will block the progress of an exonuclease, so the protected fragment extends from the labeled site to the edge of the protein furtherest from the labeled site.
One can use a combination of a 3' to 5' exonuclease (ExoIII) and a 5' to 3' exonuclease (l exonuclease) to map both edges.
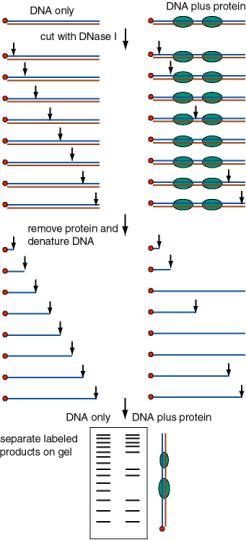
b. DNase footprint analysis
DNase I will cut at many (but not all) phosphodiester bonds in the free DNA. The protein‑DNA complex is treated lightly with DNase I, so that on average each DNA molecule is cleaved once. The presence of a bound protein will block access of the DNase, and the bound region will be visible as a region of the gel that has no bands, i.e. that was not cleaved by the reagent.
Any reagent that will cleave DNA in a non-sequence-specific manner can be used in this assay. Some chemical probes, such as copper ortho-phenanthroline, are very useful.
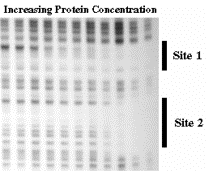
Figure 3.2.5. presents a schematic diagram of the in vitro DNase I footprint analysis in the top two panels, and then an example of the results of binding a purified transcriptional regulator to its cognate site on DNA.
Figure 3.2.5. DNase footprint analysis
3. What are the contacts between the
protein and the binding site in DNA?
a. Methylation interference reactions:
When a purine that makes contact with the protein is methylated by dimethyl sulphate (DMS), the DNA will no longer bind to the protein. Thus, DNA is gently methylated (about one hit per molecule), mixed with the protein, and then the bound complexes are separated from the unbound probe. The unbound probe will be modified at all sites (when the whole population of molecules is examined) but the bound DNA will not be modified at any critical contact points. The methylated DNA is then isolated, cleaved (with piperidine at high temperature, just like a Maxam and Gilbert sequencing reaction) and resolved on a denaturing gel. The critical contact points will be identified by the clear areas on the gel ‑ the ones that correpond to fragments that when methylated at that site will no longer bind to the protein. DMS reacts mainly with G's at N‑7, which is in the major groove of the DNA, so these are the contacts most sensitive to this reagent.
b. Other reagents are specific for the minor groove or for the phosphodiester backbone.
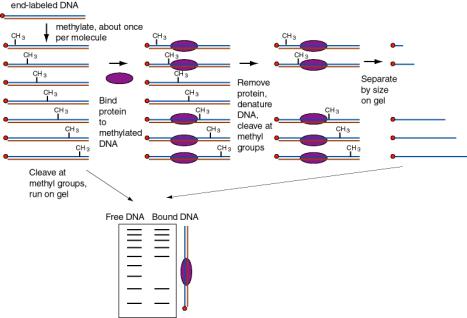
Figure
3.1.6. Methylation interference assay.
4. DNA sequence‑affinity
chromatography to purify DNA binding proteins
The specific binding sites (often 6 to 8 bp) can serve as an affinity ligand for chromatography. Multimers of the binding site are made by ligating together duplex oligonucleotides that contain the specific site. After a few crude initial steps (e.g. isolating all DNA‑binding proteins on DNA‑sepharose) the extract is applied to the affinity column. Most of the proteins do not bind, and subsequently the specifically bound proteins are eluted.
C. Promoters
and the Initiation of Transcription:
General Properties
1. A promoter is the DNA sequence
required for correct initiation of transcription
2. Phenotype
of promoter mutants
a. cis‑acting: A cis-acting regulatory element functions as a segment of DNA to affect the expression of genes on the same chromosome that it is located on. Cis-acting elements do not encode a diffusible product. The promoter is a cis-acting regulatory element.
Compare the phenotypes of mutations in the gene encoding b‑galactosidase (lacZ) versus mutations in its promoter (p).
Consider a heterozygote that is p+ lacZ‑ /p+ lacZ+ .
The phenotype is Lac+. lacZ+ complements lacZ‑ in trans. In this case, lacZ+ is dominant to lacZ-.
Consider a heterozygote that is p+ lacZ‑ /p‑ lacZ+ .
The phenotype is Lac‑. p+ does not complement p‑ in trans.
p‑ operates in cis to prevent expression of lacZ+ on this chromosome. The mutant promoter is dominant over the wild-type when the mutant promoter is in cis to the wt lacZ.
Consider a heterozygote that isp+ lacZ+ /p‑ lacZ‑ .
The phenotype is Lac+. lacZ+ now complements lacZ‑ in trans
because it is driven by a functional promoter in cis, p+
b. Dominance in cis: the promoter “allele” that is in cis to the wild-type structural gene (lacZ) is dominant over the other promoter allele.
c. Promoter mutations affect the amount of product from the gene but do not affect the structure of the gene product.
D. Bacterial promoters
1. Bacterial promoters occur just 5' to and overlap the start site for transcription (usually)
2. Bacterial
promoters are the binding site for E. coli RNA polymerase holoenzyme.
The promoter covers about 70 bp from about ‑50 to about +20.
3. Consensus sequences in the E. coli promoter
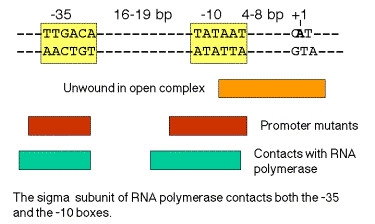
a. ‑35 and ‑10 sequences
‑35 16‑19 bp ‑10 +1
‑‑‑‑‑‑‑‑TTGACA‑‑‑‑‑‑‑‑‑‑‑‑‑‑‑‑‑--TATAAT‑‑‑CAT
Recognition by Allows binary complex to convert
RNA polymerase from closed to open
holoenzyme
b. The sequences are conserved in all E. coli genes transcribed by holoenzyme with s70
4. Promoter mutants
a. Tend to fall into or close to one of these hexanucleotides
b. Affect the level of gene expression, not the structure of the gene product
c. Down promoter mutations: decrease the level of transcription. Tend to make the promoter sequence less like the consensus.
d. Up promoter mutations: increase the level of transcription. Tend to make the promoter sequence more like the consensus.
e. Down promoter mutations in the ‑35 sequence: decrease the rate of formation of the closed complex, indicating this is the sequence needed for intial recognition by the polymerase holoenzyme.
f. Down promoter mutations in the ‑10 sequence: decrease the rate of conversion from the closed to the open complex, again supporting the proposed role for this A+T rich hexanucleotide.
g. The critical contact points between RNA polymerase and the promoter tend to be in or immediately upstream from the consensus ‑35 and ‑10 boxes. (See Fig. 3.2.7). Thus the biochemical and genetic data all support the importance of these conserved sequences.
Figure 3.2.7. Correlation of conserved sequences, location of promoter mutants, and regions of contact with polymerase at bacterial promoters
5. Alternate
s factors can control the
expression of sets of genes
a. Alternative s factors make complexes with the core polymerase to direct the new holoenzyme to a particular set of promoters that differ in sequence from the general E. coli promoter sequence. Thus the polymerase can be directed to trancribe a new set of genes. This is one way to control gene expression.
b. Examples include s factors for heat‑shock response (s32), transcription of genes involved in chemotaxis and flagellar formation (s28), and nitrogen starvation (s54). The s factors are named by their size in kDa.
c. Three of the E. coli s factors have regions of sequence similarity (s70, s32, and s28 ) whereas s54 is a distinctly different molecule that works rather differently.
|
Factor |
Gene |
Use |
‑35 |
Separation |
‑10 |
|
s70 |
rpoD |
General |
TTGACA |
16-19 bp |
TATAAT |
|
s32 |
rpoH |
Heat shock |
CCCTTGAA |
13-15 bp |
CCCGATNT |
|
s28 |
fliA |
CTAAA |
15 bp |
GCCGATAA |
|
|
s54 |
rpoN |
CTGGNA |
6 bp |
TTGCA |
E. Promoters
for eukaryotic RNA polymerases
Promoters contain binding sites for
nuclear proteins, but which of these binding sites have a function in gene
expression? This requires a
genetic approach for an answer.
1. Use of "surrogate genetics" to define the promoter
a. In vitro mutagenesis (deletions or point mutations)
(1) Mutations of the binding sites for activator proteins lead to a decrease in the level of transcription of the gene. [Loss of function].
(2) Addition of a DNA fragment containing these binding sites will activate (some) heterologous promoters. [Gain of function].
(3) Sequences of the binding sites are frequently well conserved in promoters for homologous genes from related species.
(4) A potential regulatory region is initially examined by constructing progressive deletions from the 5' end (with respect to the direction of transcription) and also from the 3' end. Subsequently one can make clusters of point mutations (e.g. by linker scanning mutagenesis) or individual point mutations.
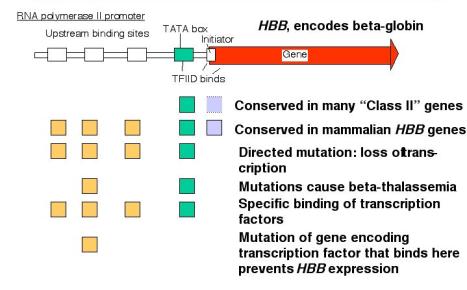
Figure 3.2.8. Evidence for an RNA polymerase II promoter.
b. Test in an expression assay
(1) The mutagenized promoter is linked to a reporter gene so that RNA or protein from that gene can be measured quantitatively
(a) Gene itself ‑ measure RNA production by S1 protection, primer extension, or other assay that is specific for a particular RNA
(b) Heterologous reporter gene: encodes an enzyme whose activity is easy to measure quantitatively. Note that these measures of expression require both transcription and translation, in contrast to measurement of RNA directly. E.g., the genes encoding:
[1] b‑galactosidase: colorimetric assay, monitor the cleavage of o‑nitrophenyl‑b‑galactoside
[2] chloramphenicol (Cm) acetyl transferase (CAT): measure the acetylation of Cm, ususally use [14C] Cm; this is the enzyme that confers resistance to Cm in bacteria
[3] luciferase: monitor the emmission of photons resulting from the ATP‑dependent oxidation of luciferin; this is the enzyme that catalyzes light production in firefly tails
(2) The promoter‑reporter DNA constructs are introduced into an assay system that will allow the reporter to be expressed.
(a) Whole cells
microinjection into Xenopus oocytes
transfection of cell lines: introduce the DNA via electroporation or by getting the cells to take up a precipitate of DNA and Ca phosphate by pinocytosis
(b) Whole animals = transgenic animals
Introduce the DNA into the germ line of an animal, in mammals by microinjecting into a fertilized egg and placing that into a pseudopregnant female. This technology allows one to examine the effects of the mutation throughout the development of the animal.
(c) Cell‑free systems
Extracts of nuclei, or purified systems (i.e. with all the necessary components purified)
2. Promoter for RNA Pol II
a. The minimal promoter is needed for basal activity and accurate initiation.
(1) Needed for assembly of the initiation complex at the correct site
(2) DNA sequences
(a) TATA box
[1] Initially identified as a well conserved sequence motif about 25 bp 5' to the cap site (The cap site is the usual start site for transcription)
[2] The transcription factor TFIID binds to the TATA box
[3] Mutations at the TATA box generates heterogeneous 5' ends of the mRNAs ‑ indicative of a loss of start site specificity
(b) Initiator
[1] Sequences at the start site for transcription have consensus YANWYY
(Y = C or t, W = T or A)
[2] Mode of action is still under investigation. Recent data indicate that TFIID also binds to the initiator; binds to one of the TAFs (see below).
(3) TATA plus initiator is the simplest minimal promoter.
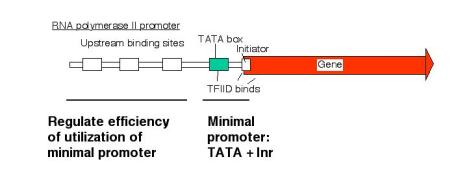
Figure 3.2.9. Two general parts of promoters for RNA polymerase II.
b. The amount of expression is regulated via upstream elements.
(1) Proteins bind to specific sequences (usually) 5' to the TATA box to regulate the efficiency of utilization of the promoter.
(2) These are frequently activators, but proteins that exert negative control are also being characterized.
(3) Examples of activator proteins
Sp1: binds GGGGCGGGG = GC box
Octn: binds ATTTGCAT = octamer motif
Oct1 is a general factor (ubiquitous)
Oct2 is specific for lymphoid cells
CP1, CTF = NF1, C/EBP bind to CCAAT = CCAAT box (pronounced "cat" box)
These are different families of proteins, CP1 and CTF are found in many cell types, C/EBP is found in liver and adipose tissue.
(4) These upstream control elements may be inducible (e.g. by hormones), may be cell‑type specific, or they may be present and active in virtually all cell types (i.e. ubiquitous and constitutive).
Figure 3.2.10.
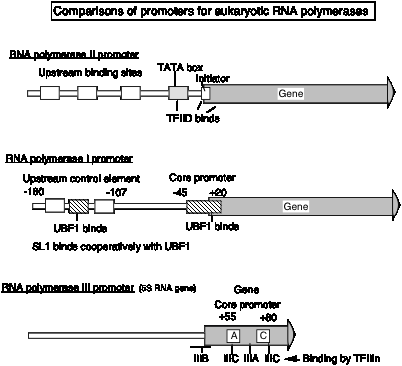
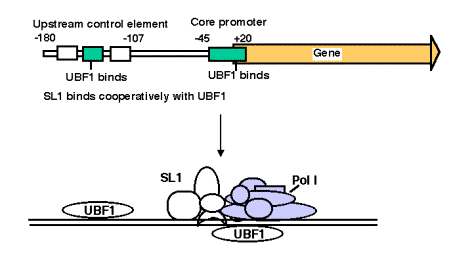
3. Promoter for RNA Pol I
a. The core promoter covers the start site of transcription, from about ‑40 to about +30. The promoter also contains an upstream control element located about 70 bp further 5', extending from ‑170 to ‑110.
b. The factor UBF1 binds to a G+C rich sequence in both the upstream control element and in the core promoter. A multisubunit complex called SL1 binds to the UBF1‑DNA complex, again at both the upstream and core elements. One of the subuntis of SL1 is TBP.
c. RNA polymerase I then binds to this complex of DNA+UBF1+SL1 to initiate transcription at the correct nucleotide and the elongate to make pre‑rRNA.
Fig. 3.2.11. Binding of proteins for promoter for RNA polymearase I
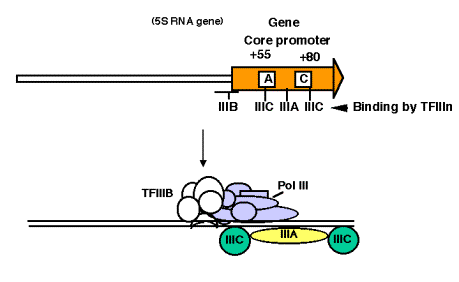
4. Promoter for RNA Pol III
a. This promoter has internal control sequences.
Deletion of 5' flanking DNA still permits efficient transcription of (most) genes transcribed by RNA PolIII. Even the intial part of the gene is expendable, as is the 3' end. Sequences internal to the gene (e.g. +55 to +80 in 5S rRNA genes) are required for efficient initiation, in contrast to the familiar situation in bacteria, where most of the promoter sequences are 5' to the gene.
b. As discussed above, TFIIIA binds to the internal control region of genes that encode 5S RNA (type 1 internal promoter). TFIIIC binds to internal control regions of genes for 5S RNA (alongside TFIIIA) and for tRNAs (type 2 internal promoters). The binding of TFIIIC directs TFIIIB to bind to sequences (-40 to +11) that overlap the start site for transcription. One subunit of TFIIIB is TBP, even though no TATA box is required for transcription. TFIIIA and TFIIIC can now be removed without affecting the ability of RNA polymerase III to initiate transcription. Thus TFIIIA and TFIIIC are assembly factors, and TFIIIB is the initiation factor.
c. RNA polymerase III binds to the complex of TFIIIB+DNA to accurately and efficiently initiated transcription.
Fig. 3.2.11. Binding of proteins for promoter for RNA polymearase III
F. Enhancers
1. Enhancers are DNA sequences that cause an increase in the level of expression of a gene with an intact promoter. They may act to increase the efficiency of utilization of a promoter, or they may increase the probability that a promoter is in a transcriptionally competent chromatin conformation. This will be explored further in Part Four.
2. They are operationally defined by their ability to act in either orientation and at a variety of positions and distances from a gene, i.e. act independently of orientation and position. This contrasts with promoters, that act (usually) in only one orientation and (usually) are at or close to the 5' end of the gene.
3. They consist of binding sites for specific activator proteins. Always have multiple binding sites, often for several different activator proteins.
4. Particular sets of genes can be regulated by their need for defined sets of activator proteins at their enhancers.
G. Elongation
of transcription
1. RNA polymerase must be released from the initiation complex to transcribe the rest of the gene. Elongation must be highly processive, i.e. once the polymerase begins elongation, it must transcribe that template all the way to the end of the gene.
2. The factors required for initiation are not needed (and may inhibit) elongation, and they dissociate.
s in bacteria: The conformation of the polymerase changes upon dissociation of s to that it enters a processive mode for elongation.
For eukaryotic transcription by RNA polymerase II, TFIID and TFIIA are thought to stay behind after the transcription complex clears the promoter. The release of the transcription complex from the promoter appears to be dependent on the phophorylation of the CTD of RNA polymerase II. One of the protein kinases implicated in this process is TFIIH, but others, such as P-TEFb, have also been implicated.
Fig. 3.2.13. Model for role of phosphorylation of RNA polymerase in shift from initiating to elongating enzyme.
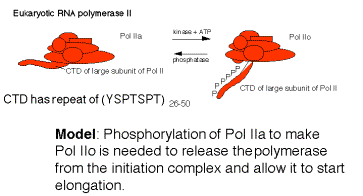
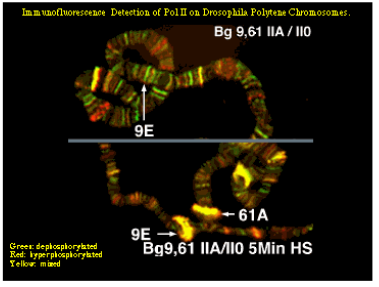
Fig. 3.2.14. Supportive evidence: Immunofluoresence shows Pol IIa is on heat shock genes when quiescent (stalled polymerases), but Pol IIo is present once the genes are actively transcribed (elongating polymerases).
3. There is some indication that factors that increase the processivity of the transcription complex bind to the elongating polymerase. Examples include the following.
NusA in bacteria
GreA and GreB in bacteria
TFIIS in eukaryotes, possibly many others.
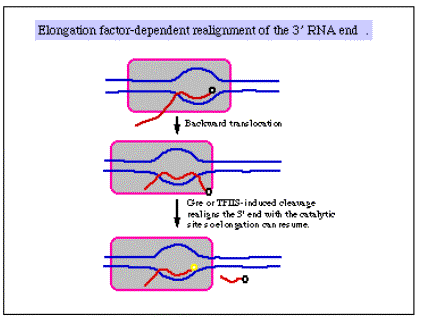
4. GreA and GreB in E. coli and TFIIS in eukaryotes induce hydrolytic cleavage of the transcript within the RNA polymerase, followed by release of the 3' terminal RNA fragment. This process has been implicated in overcoming pausing of the polymerase.
Fig. 3.2.15. Cleavage of RNA to help overcome pausing
4. Regulation of elongation is an under‑studied area at present. In fact, many transcription complexes pause about 20 nt into the gene, and stay there, primed for transcription, until they are released for elongation in response to some stimulus. The classic example are the heat shock genes in Drosophila, but this may be a fairly general phenomenon.
5. The regulation of transcription is primarily at initiation (in most cases) but that regulation can be exerted at the frequency of assembling an initiation complex or by the frequency of release into the elongation mode (or any step prior to elongation).
6. The elongation rate averages about 50 nt per sec. This is not a constant rate and many pause sites are seen. Also, some templates may be transcribed at different rates.
7. Variation in elongation rate will not affect the output of gene product (e.g. transcript). It will affect the lag time between initiation and the first appearance of a product. Of course, a sufficiently long pause, i.e. when no elongation occurs, can reduce the amount of RNA synthesized from a gene.
8. As an illustration of the importance of elongation in regulation, consider the Tat and tar system in the human immunodeficiency virus, HIV. This case study also illustrates the complexity of the system.
Elongation of transcription in HIV requires the virally-encoded protein Tat that binds to an RNA structure centered at about +60, called the tar . Elongation requires the CTD of RNA polymerase II, and now it is clear that Tat leads to phosphorylation of the CTD. One step, probably promoter clearance, uses the kinase activity in the CDK7 subunit of TFIIH (or a trimeric complex of CDK7, cyclin H, and MAT1, referred to as CAK). Thiswas shown by the ability of a pseudosubstrate inhibitor of CDK7 to block Tat-dependent elongation.
Further phosphorylation of the CTD of RNA polymerase II is catalyzed by the positive transcription elongation factor b, called P-TEFb, which contains a kinase subunit known as PITALRE or CDK9. P-TEFb is needed for Tat-stimulated elongation of transcripts from the HIV promoter (a combination of promoter and enhancer called a long terminal repeat, or LTR). A stylized example of these data is shown below.
The inhibitor of elongation, DRB, blocks the P-TEFb kinase. Indeed, a random screen of >100,000 compounds for the ability to block Tat-stimulated HIV transcription found several new compounds. All of these blocked elongation, and many structurally diverse compounds also inhibit the P-TEFb kinase. Thus Tat-dependent activation works through both TFIIH (perhaps at promoter clearance) and P-TEFb (for full elongation).
Fig. 3.2.16.
P-TEFb is needed for elongation in HIV.

Figure legend. When a DNA template containing the LTR and encoding the TAR is used for in vitro transcription in a HeLa cell nuclear extract (which is competent for transcription by RNA polymerase II and associated general transcription factors) plus all 4 ribonucleoside triphosphates, a short RNA of about 70 nucleotides is produced (lane 1 in the figure below). Addition of increasing amounts of Tat (indicated by the triangle labeled Tat) causes transcription to continue to the end of the template, to produce a "run-off" transcript of about 700 nucleotides (lanes 2-4; darker shading indicates greater abundance). The results of removing the segment of DNA encoding the TAR from the template is shown in lanes 5-8. A cellular protein kinase complex called P-TEFb has been found associated with Tat. It can be removed from the HeLa cell nuclear extract, and the effects of this treatment are shown in lanes 9-12.
For a review of this work, see the article by K. A. Jones (1997) "Taking a new TAK on Tat transactivation." Genes & Development 11: 2593-2599.
H. Termination of transcription in E. coli
1. Terminator sequences in E. coli cause pausing by RNA polymerase
Figure 3.2.17.

a. r‑independent sites [Note: r = rho]
(1) Identified in vitro
(2) G+C rich hairpin followed by about 6 U's
(3) Hairpin is thought to be a site at which RNA polymerase pauses, and the weak rU‑dA base pairs in the RNA‑DNA heteroduplex allow melting of the duplex and termination.
(4) Some of the best examples of r-independent terminators are integral parts of the mechanism of regulation. Examples include the attenuators in the trp operon and other amino acid biosynthetic operons. The r-independent terminators may be a specialized adaptation for regulation.
b. r‑dependent sites
(1) C‑rich, G‑poor stretch
(2) Requires the action of the protein r both in vitro and in vivo
(3) The r-dependent terminators are used at the 3' ends of many eubacterial genes.
2. r factor
a. Hexamer, each subunit 46 kDa
b. RNA‑dependent ATPase
c. Gene for r is essential for E. coli
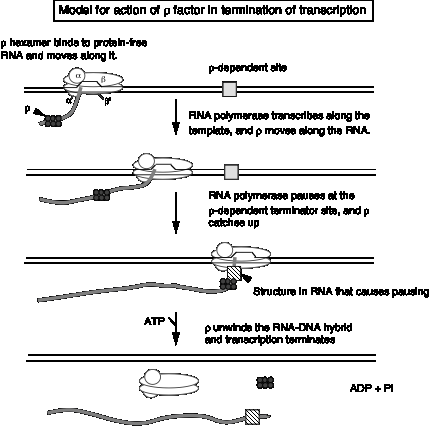
3. Model for action of r factor
a. r binds to protein‑free RNA and moves along it
b. When it reaches a paused polymerase, it causes the polymerase to dissociate and unwinds the RNA‑DNA duplex, thereby terminating transcription. This last step utilizes the energy of ATP hydrolysis. The protein r serves as the ATPase.
Figure 3.2.18.
![]()
I. Termination
of transcription in eukaryotes
1. Termination by RNA Pol II
a. No clear evidence for a discrete terminator for RNA polymerase II
b. 3' end of mRNA is generated by cleavage and polyadenylation
c. Signal for cleavage and polyadenylation:
(1) AAUAAA, about 20 nt before the 3' end of the mRNA
(2) Other sequences 3' to cleavage site
d. Cleavage enzyme not well characterized at this point; the U4 snRNP may play a role in cleavage. A polyA polymerase has been identified.
e. Polyadenylation is required for termination by RNA Pol II; possibly also pausing by the RNA polymerase
2. Termination by RNA Pol III:
Termination occurs at a run of 4‑5 T's (on the nontemplate strand of DNA) surrounded by GC‑rich DNA
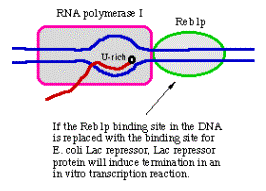
3. Termination by RNA Pol I:
Termination requires an 11 bp binding site for the protein Reb1p, which causes the polymerase to pause, and a 46 bp segment located 5' to the Reb1p site, which may be required for release of the polymerase [Lang...Reeder (1994) Cell, 79:527-534].
Strong pausing may be a component of the transcription termination process for several RNA polymerases.
Fig. 3.2.19. Model for termination by RNA polymerase I
J. mRNA
structure in bacteria
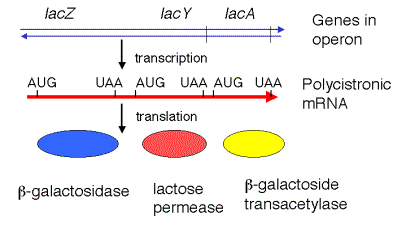
1. Bacterial mRNA is often polycistronic.
One transcript can encode the products from several adjacent genes.
a. The set of adjacent genes that are transcribed into one mRNA is an operon.
b. This organization allows for common transcriptional control. Thus is ti part of the mechanism for coordination of expression of genes whose products are required at the same time.
E.g. The lac operon, lacZYA, encodes three enzymes involved in the uptake and metabolism of lactose.
c. Production of proteins from polycistronic mRNAs requires initiation at internal AUGs, allowing for translation of the part of the mRNA encoding the second, third, etc. proteins.
Figure 3.2.20. A polycistronic operon in E. coli.
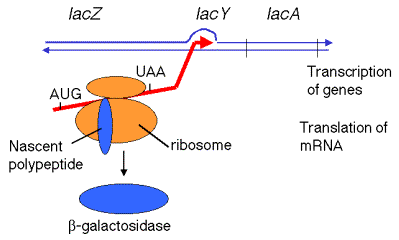
2. The initial transcript is also translated and subsequently degraded.
That is, transcription, translation and degradation are all going on simultaneously. The mRNA (ususally) is not extensively processed prior to translation.
Figure 3.2.20. Translation occurs simultaneously with transcription in bacteria.
K. Polarity
The phenomenon
of polarity occurs because of tight linkage between transcription and
translation in bacteria.
1. Definition: Polar mutations are mutations early in the operon that exert a negative effect on the expression of genes later in the operon. This is generally a result of (some) nonsense mutations (those that cause premature termination of translation) in a gene toward the 5' end of the operon, which results in a cessation of transcription before the the subsequent genes are reached.
Figure 3.2.21.
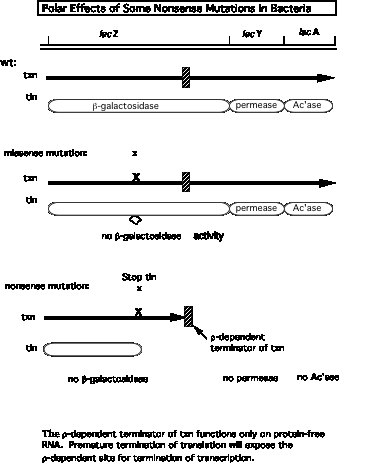
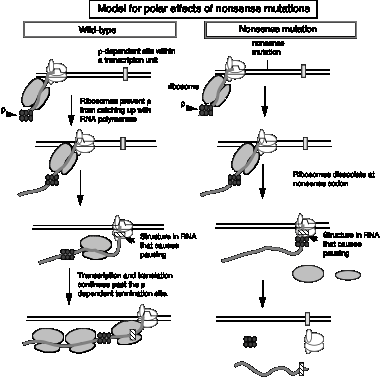
2. Model for r action can explain why stopping translation can also lead to a cessation of transcription.
a. Suppose a r‑dependent terminator of transcription is present in the first gene of an operon. Normally it does not cause transcription to stop because it is covered by ribosomes translating the mRNA, and the subsequent genes in the operon are transcribed. Recall that r requires protein‑free RNA to bind to and to move along.
b. A nonsense mutation before the cryptic r‑dependent terminator would cause the ribosomes to dissociate, now exposing the cryptic terminator in a protein‑free stretch of RNA. The hexamer r can bind and move along the RNA, and when it encounters an RNA polymerase stalled, or paused, at the terminator, it will cause the RNA polymerase to dissociate and the RNA to be released, hence preventing transcription of the subsequent genes in the operon.
Figure 3.2.22.
3. Mutations
in r suppress polarity of
nonsense mutations
Since r is no longer functional, termination does not occur at the r‑dependent site early in the operon, and subsequent genes are then transcribed. So even though translation will still terminate in the first gene, transcription (and then translation) will continue in the downstream genes of the operon.
L. mRNA
structure in eukaryotes
1. Most mRNAs in eukaryotes are capped at their 5' ends and polyadenylated at their 3' ends.
Figure 3.2.23.
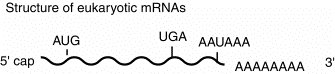
This general structure is true for almost all eukaryotic mRNAs. The cap structure is almost ubiquitous. A few examples of mRNAs without poly A at the 3' end have been found. Some of the most abundant mRNAs without poly A encode the histones. However, most mRNAs do have the 3' poly A tail.
The poly A tail at the 3' end can be used to purify mRNAs from other RNAs. Total RNA from a cell (which is about 90% rRNA and less than 10% mRNA) can be passed over an oligo(dT)-cellulose column. The poly A-containing mRNAs will bind, whereas other RNAs will elute.
Questions, Chapter 11. Transcription: Promoters and Terminators
11.1 Determining the sequences that encode the ends of mRNAs.
A gene that determines eye color in salamanders, called almond, is contained within a 2000 bp KpnI fragment. After cloning the KpnI fragment in a plasmid, it was discovered that it has a BglII site 500 bp from the left KpnI site and an EcoRI site 300 bp from the right KpnI site, as shown in the map below.
bp 0 500 1000 1500 2000
| | | | |
| | | |
KpnI BglII EcoRI KpnI
In order to determine the positions that correspond to the 5' and 3' ends of the almond RNA, the EcoRI and BglII sites were labeled at the 5' or 3' end. The KpnI to BglII fragments (500 and 1500 bp) and the KpnI to EcoRI fragments (1700 and 300 bp) were isolated, hybridized to almond RNA and treated with the single‑strand specific nuclease S1. The sizes of the probe fragments protected from digestion in the RNA‑DNA duplex are shown below (in nucleotides); a 0 means that the probe was not protected by RNA.
5' end‑labeled probe 3' end‑labeled probe
protected protected
probe fragment probe fragment
KpnI‑BglII* 500 0 KpnI‑BglII* 500 100
*BglII‑KpnI 1500 1300 *BglII‑KpnI 1500 0
KpnI‑EcoRI* 1700 0 KpnI‑EcoRI* 1700 1300
*EcoRI‑KpnI 300 100 *EcoRI‑KpnI 300 0
The asterisk denotes the end that was labeled.
a) What is the direction of transcription of the almond gene, relative to the map above?
b) What position on the map corresponds to the 5' end of the mRNA?
c) What position on the map corresponds to the 3' end of the mRNA?
11.2 Determining the sequences that encode the ends of mRNAs.
The gene for histone H2A from armadillo can be isolated as a 1400 bp PstI fragment. The map is shown below; the armadillo PstI fragment is shown by the double dashed line, and the vector DNA is denoted by the single dashed lines. Sizes are in base pairs. The H2A gene clone was cleaved with HindIII, treated with alkaline phosphatase, and incubated with polynucleotide kinase and [32P] ATP in an appropriate buffer to introduce a radiolabel at the 5’ ends of the DNA fragments. The DNA was then extracted with phenol to remove the kinase, and then cut again with PstI. The labeled 600 bp and 800 bp PstI-HindIII fragments were separated by gel electrophoresis and isolated. The isolated fragments were denatured, hybridized to histone mRNA, and treated with nuclease S1. The S1-resistant labeled DNA fragments were identified by gel electrophoresis followed by radioautography. A 200 nucleotide protected fragment was observed when the 600 bp fragment was used in the S1 protection assay, but no protected fragment was observed when the 800 bp fragment was used.
|--------------600----------------|-------------800----------------|
PstI HindIII PstI
---------|====================|===================|-----------
| | | |
0 500 1000 1400
a) What is the direction of transcription of the histone H2A gene (relative to the restriction map above)?
b) With reference to the numbers below the restriction map, what is the position of the 5' end of the histone H2A mRNA?
c) What is the position of the 3' end of the mRNA?
11.3 A 400 bp DNA fragment containing the start site for transcription of the almond gene was investigated to find transcriptional control signals. The start site (+1 in the coordinate system) is 100 bp from the right end. The 400 bp fragment is sufficient to drive transcription of a reporter gene (for luciferase) in an appropriate cell line. Two series of 5' and 3' deletions were made in the 400 bp fragment and tested for their ability to drive transcription of the luciferase reporter gene. Each fragment in the 5' deletion series has a different 5' end, but all are fused to the luciferase gene at +100 (see diagram below). Each fragment in the 3' deletion series has a common 5' end at ‑300, but each is fused to the luciferase gene at the designated 3' position. The amount of luciferase (a measure of the level of transcription) for each construct is shown in the first two pairs of columns in the table. The intact reporter construct, with almond DNA (the horizontal line) fused to the luciferase gene, is diagrammed immediately below.
‑300 ‑250 ‑200 ‑150 ‑100 ‑50 +1 +50 +100
| | | | | | | | |
________________________________________________|Luciferase>
|
start>
To further investigate the function of different regions, sub‑fragments of the almond DNA fragment were added to a construct in which the reporter gene was driven by a different promoter, as diagrammed below. The effects of the almond DNA fragments on this heterologous promoter are shown in the third pair of columns in the table.
Test
fragment from almond DNA
heterologous promoter Luciferase
gene>
___________________________|‑‑‑‑‑‑‑‑‑‑‑‑‑‑‑‑‑‑‑‑‑‑‑----‑|**************>
____________________ _____________________ _______________________
|
5' deletion endpoints |
Amount
of expression |
3'
deletion endpoints |
Amount
of expression |
|
Test
fragment of almond |
Amount of expression |
|
‑300 |
100 |
‑200 |
0 |
|
‑300 to ‑250 |
100 |
|
‑250 |
100 |
‑150 |
0 |
|
‑250 to ‑200 |
500 |
|
‑200 |
50 |
‑100 |
0 |
|
‑200 to ‑150 |
100 |
|
‑150 |
50 |
‑50 |
0 |
|
‑150 to ‑100 |
300 |
|
‑100 |
25 |
+1 |
100 |
|
‑100 to ‑50 |
300 |
|
‑50 |
10 |
+50 |
100 |
|
‑50 to ‑1 |
100 |
|
‑1 |
0 |
+100 |
100 |
|
none |
100 |
a) What do you conclude is the role of the ‑250 to ‑200 fragment?
b) What do you conclude is the role of the ‑200 to ‑150 fragment?
c) What do you conclude is the role of the ‑150 to ‑100 fragment?
d) What is the role of the ‑50 to ‑1 fragment of the almond gene?
11.4 An electrophoretic mobility shift assay was used to test for the ability of a short restriction fragment to bind to proteins from the nuclei of kidney cells. The restriction fragment was labeled at one end, mixed with an extract containing the nuclear proteins, and run on a non-denaturing polyacrylamide gel. Lane 1 (below) shows the free probe and lane 2 shows the the probe plus extract; electrophoresis is from the top to the bottom. Complexes between proteins and the labeled DNA probe move more slowly on the gel than does the free probe. Further tests of specificity are shown in the competition lanes, in which the labeled probe was mixed with an increasing excess of other DNA before mixing with the nuclear proteins to test for binding. Competitor DNAs included the unlabeled probe (self competition, lanes 3-5; the triangle above the lanes indicates that an increasing amount of competitor is used in successive lanes), a completely different DNA (sheared E. coli DNA) as a nonspecific competitor (lanes 6-8), and two different duplex oligonucleotides, one containing the binding site for Sp1 (lanes 9-11) and the other containing the binding site for Oct1 (lanes 12-14). Thinner, less densely filled boxes denote bands of less intensity than the darker, thicker bands.
a) How many protein-DNA complexes are formed between the labeled DNA probe and the nuclear extract?
b) What do lanes 3-8 tell you about the protein-DNA complexes?
c) What do lanes 9-14 tell you about the protein-DNA complexes?
11.5 In order to determine the contact points between a regulatory protein and its binding site on the DNA, a small fragment of duplex DNA was end‑labeled (at the 5' terminus of the left end as written below) and treated with dimethyl sulfate so that each molecule on average has one G nucleotide methylated. The regulatory protein was mixed with the preparation of partially methylated DNA, and protein‑bound DNA was separated from unbound DNA. After cleaving the DNA at the methylated sites, the resultant fragments were resolved on a "sequencing gel". An autoradiogram of the results showed bands corresponding to all the G's in the labeled fragment for the unbound DNA, but the protein‑bound DNA did not have bands corresponding to the G's at positions 14 and 16 below. When the left end of the fragment was labeled at the 3' terminus, no band corresponding to the G (bottom strand) at position 18 (same numbering system as for top strand) was seen in the preparation of protein‑bound DNA.
5 10
15 20 25 30
| | | | | |
5' GATCCGCATGGATGAGTCACGTAACGTGTA
3' GCGTACCTACTCAGTGCATTGCACAT
What is the binding site for the regulatory protein?
11.6 Are the following statements about r and polar effects of some mutations in operons in E. coli true or false?
a) Nonsense mutations (terminating translation) in the first gene of an operon can have no effect on the transcription of subsequent gene in the operon.
b) Mutations in the gene for r (rho gene) can suppress polarity.
c) The hexameric protein r binds to protein‑free RNA and moves along the RNA; when it encounters a stalled RNA polymerase it promoters termination of transcription.
d) The protein r is an RNA‑dependent ATPase.