CHAPTER
2
STRUCTURES
OF NUCLEIC ACIDS
DNA and RNA are both nucleic acids, which are the polymeric acids isolated from the nucleus of cells. DNA and RNA can be represented as simple strings of letters, where each letter corresponds to a particular nucleotide, the monomeric component of the nucleic acid polymers. Although this conveys almost all the information content of the nucleic acids, it does not tell you anything about the underlying chemical structures. This chapter will be review the evidence that nucleic acids are the genetic material, and then exploring the chemical structure of nucleic acids.
Genes are DNA (Nucleic Acid)
Mendle’s experiments in the late 19th century the showed that a gene is a discrete chemical entity (unit of heredity) that is capable of changing (mutable). At the beginning of the 20th century Sutton and Boveri realized that a gene is part of a chromosome. Subsequent experiments in the early to middle of the 20th century showed that chemical entity is a nucleic acid, most commonly DNA.
Pneumococcus transformation experiments
Griffith (1928) was a microbiologist working with avirulent strains of Pneumococcus; infection of mice with such strains does not kill the mice. He showed that these avirulent strains could be transformed into virulent strains, that is, infection with the transformed bacteria kills mice (Fig. 2.1.A.). Smooth (S) strains produce a capsular polysaccharide on their surface, which allow the Pneumococi to escape destruction by the mouse, and the infection proceeds, i.e. they are virulent. This polysaccaride can be type I, II, or III. Virulent S strains can be killed by heat (i.e., sterilization) and, of course, the dead bacteria can no longer infect the mouse.
The smooth strains can give rise to variants that do not produce the polysaccharide. Colonies of these bacteria have a rough (R) appearance, but more importantly they are not immune to the mouse's defenses, and cannot mount a lethal infection, i.e. they are avirulent.
When heat-killed S bacteria of type III are co-inoculated with live R (avirulent) bacteria derived from type II, the mouse dies from the productive infection. This shows that the live R bacteria had acquired something from the dead S bacteria that allowed the R bacteria to become virulent! The virulent bacteria recovered from the mixed infection now had a smooth phenotype, and made type III capsular polysaccharide. They had been transformed from rough to smooth, from type II to type III. Transformation simply means that a character had been changed by some treatment of the organism.
In 1944, Avery, McCarty and Macleod showed that the transforming principle is DNA. Earlier work from Friedrich Meicher (around 1890 to 1900) showed that chromosomes are nucleic acid and protein. Avery, McCarty and Macleod used biochemical fractionation of the bacteria to find out what chemical entity was capable of transforming avirulent R into virulent S bacteria, using the pneumococcus transfomation assay of Griffith. Given the chromosomal theory of inheritance, it was thought most likely that it would be protein or nucleic acid. At this time, nucleic acids like DNA were thought to be short oligonucleotides (four or five nucleotides long), functioning primarily in phosphate storage. Thus proteins, with their greater complexity, were the favored candidate for the transforming entity, at least before the experiment was done.
Different biochemical fractions of the dead S bacteria were added to the live R bacteria before infection, testing to see which fraction transformed avirulent R into virulent S bacteria. The surprising result was that DNA, not protein, was capable of transforming the bacteria. The carbohydrate fraction did not transform, even though it is a polysaccharide that makes the bacteria smooth, or S. Neither did the protein fraction, even though most enzymes are proteins, and proteins are a major component of chromosomes. But the DNA fraction did transform, showing that it is the "transforming principle" or the chemical entity capable of changing the bacteria from rough to smooth.
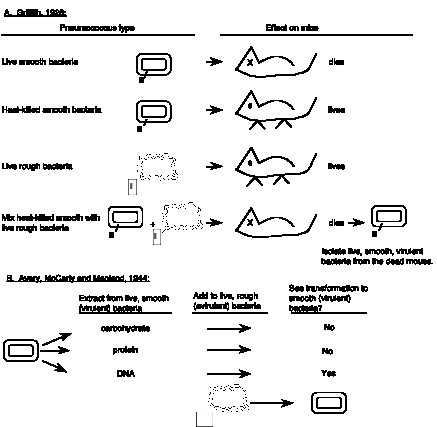
Figure 2.1. DNA is the transforming principle, i.e. the chemical entity that can confer a new phenotype when introduced into bacteria. A. The transformation experiments of Griffith. B. The chemical fractionation and transformation experiments of Avery, McCarty and Macleod.
At the time it was thought that DNA did not have sufficient complexity to be the genetic material. However, we now know that native DNA is a very long polymer and these earlier ideas about DNA being very short were derived from work with highly degraded samples.
DNA, not protein, is passed on to progeny
Hershey and Chase (1952) realized that they could use two new developments (at the time) to rigorously test the notion that DNA was the genetic material. Bacteriophage (or phage, or viruses that infect bacteria) had been isolated that would infect bacteria and lyse them, producing progeny phage. By introducing different radioactive elements into the protein and the DNA of the phage, they could determine which of these components was passed on to the progeny. Only genetic, inheritable material should have this property. (This was one of the earliest uses of radioactive labels in biology.)
As diagrammed in Fig. 2.1, The proteins of T2 phage were labeled with 35S (e.g. in methionine and cysteine) and the DNA was labeled with 32P (in the sugar-phosphate backbone, as will be presented in the next section). The bacterium E. coli was then infected with the rabiolabeled phage. Shortly after the infection, Hershey and Chase knocked the phage coats off the bacteria by mechanical disruption in the Waring Blender, and monitored where the radioactivity went. Most of the 35S (80%) stayed with the phage coats, and most of the 32P (70%) stayed with the infected bacteria. After the bacteria lysed from the infection, the progeny phage were found to carry about 30% of the input 32P but almost none (<1%) of the 35S. Thus the DNA (32P) behaved like the genetic material - it went into the infected cell and was found in the progeny phage. The protein (35S) largely stayed behind with the empty phage coats, and almost none appeared in the progeny.

Figure 2.1. Genetic material of phage T2 is DNA.
Some genomes are RNA
Some viruses have RNA genomes. The key concept is that some form of nucleic acid is the genetic material, and these encode the macromolecules that function in the cell. DNA is metabolically and chemically more stable than RNA. One tends to find RNA genomes in organisms that have a short life span.
Even prions are not exceptions to this rule that genomes are composed of nucleic acids. Prions are capable of causing slow neuro-degenerative diseases such as scrapie or Jacob -Cruetzfeld disease (causing degeneration of the CNS in sheep or humans, respectively). They contain no nucleic acid, and in fact are composed of a protein that is encoded by a normal gene of the "host." The pathogenesis of prions appears to result from an ability to induce an "abnormal" conformation to the pre‑prion proteins in the host. Their basic mode of action could involve shifting the equilibrium in protein folding pathways.
We will now turn to the chemistry of nucleic acids.
Keto-
Amino-
 Components
of nucleic acids
Components
of nucleic acids
|
Keto- |
|
Amino- |
Nucleotide bases
Nucleic acids are the acidic component of nuclei, first identified by Meischer in the late 19th century. Subsequent work showed that they are polymers, and the monomeric subunit of nucleic acids was termed a nucleotide. Hence nucleic acids are polymers of nucleotides. Nucleotides are composed of bases, sugar and phosphate. The bases are either pyrimidines or purines.


Amino- Keto-
Figure 2.3. Pyrimidine bases
Pyrimidines are 6 member, heterocyclic aromatic rings (Fig. 2.3.). The 2 nitrogen atoms are connected to the 4 carbon atoms by conjugated double bonds, thus giving the base substantial aromatic character. All the common pyrimidines in DNA and RNA have a keto group at C2, but they differ in the substituents at C4, at the "top" of the ring. As we will see later, the substituents at C4, as well as N3 of the ring, are involved in H-bonding to complementary bases in the secondary structures of nucleic acids. Cytosine is referred to as the "amino" pyrimidine base, because of its exocyclic amino group at C4. The "keto" bases are uracil and thymine, again named because of their keto groups at the top of the ring. Thymine is 5‑methyl uracil; it is found only in DNA. Thymine and uracil are identical at the N3 and C4 positions, and they will both form H-bonds with adenine (see below).
Pyrimidines can exist in either keto (lactam) or enol (lactim) tautomer; they exist in the keto form in nucleic acids.
Figure 2.4. Tautomers of thymine

Purines have two heterocyclic rings, a 6-member ring that resembles a pyrimidine fused to a 5 member imidazole ring. Unfortunately, the conventions for numbering the ring atoms in purines differ from those of pyrimidines.
Figure 2.5. Purines


(1) The substituents at the "top" of the 6-member ring of the 2-ring system (i.e. at C6) are major determinants of the H-bonding (or base pairing) capacity of the purines. The "amino" base for purines is adenine, which is 6‑aminopurine. This amino group serves serves as the H-bond donor in base pairs with the C2 keto group of thymine or uracil. Using similar conventions, the "keto" base for purines is guanine; note the keto group at C6.
(2) The C2 of guanine is bonded to two nitrogens within the ring (as is true for all purines) and also to an exocyclic amino group. Thus atoms 1,2, and 3 of guanine form a guanidino group:
NH2
|
-NH-C=N-
This is the same as the functional group in arginine, but it is not protonated at neutral pH because of the electron-withdrawing properties of the aromatic ring system. The "guan" part of the name of the guanidino group and of guanine comes from guano, or bat droppings. These excretions are rich sources of purines.
Purines also undergo keto‑enol tautomerization, and again the keto tautomer is the more prevalent in nucleic acids.
Figure 2.6. Tautomers of guanine

All these bases have substantial aromatic character. Delocalized p electrons are shared around the ring. Because of this, the bases absorb in the UV. For DNA and RNA, the l max = 260 nm. Since electrons are withdrawn from the amino groups, they are not protonated at neutral pH: the bases are not positively charged.
The keto‑enol tautomerization contributes to mutations: the enol form will make different base pairs than the keto form. This will be covered in more detail in Chapter 7.
Nucleosides
Nucleosides are purine or pyrimidine bases attached to a pentose sugar.
a. Sugars
ribose (b‑D‑ribofuranose) in RNA
2‑deoxyribose (b‑D‑2‑deoxyribofuranose in DNA)
Figure 2.7.

The purine or pyrimidine base is connected to the (deoxy)ribose via an N‑glycosidic bond between the N1 of the pyrimidine, or N9 of the purine, and C1 of the sugar. Note that the sugar is the b anomer at C1 (the bond points "up" relative to the sugar ring) and the base is "above" the sugar ring in the nucleoside.
 Figure
2.8.
Figure
2.8.
2’-deoxy-
The purine or pyrimidine ring can rotate freely around the N‑glycosidic bond. In the syn conformation, the purine ring is "over" the pentose ring, and the anti conformation, it is away from the pentose.
Nucleotide
A nucleotide is a base attached to a sugar attached to a phosphate; it is a nucleoside esterified to a phosphate.
Figure 2.9.
g b a

The phosphate is attached by an ester linkage to a hydroxy group on the sugar, usually to the 5' or 3' OH. Note that the atoms in the (deoxy)ribose ring are numbered 1', 2', 3', etc. when in nucleotides or nucleic acids to avoid confusion with the numbering system of the bases. Sometimes the connection with phosphate is at the 2' position in RNA, as we will see in splicing.
1, 2 or 3 phosphates (or more) can be attached to 5' or 3' position. Starting at the 5'-OH, these phosphates are called a, b, g.
The nomenclature for the five types of bases, nucleosides and nucleotides is as follows:
Base Nucleoside Nucleotide
nt Abbrev.
A adenine adenosine adenosine‑5'‑monophosphate
= adenylic acid AMP, dAMP
G guanine guanosine guanosine‑5'‑monophosphate
= guanylic acid GMP, dGMP
C cytosine cytidine cytidine‑5'‑monophosphate
= cytidylic acid CMP, dCMP
U uracil uridine uridine‑5'‑monophosphate
= uridylic acid UMP
T thymine thymidine thymidine‑5'‑monophosphate
= thymidylic acid (d)TMP
Primary structure of nucleic acids
Phosphodiester linkages
The 3' OH of the (deoxy) ribose of one nucleotide is linked to the 5' OH of the (deoxy)ribose of the next nucleotide via a phosphate. The phosphate is in an ester linkage to each hydroxyl, i.e. a phosphodiester group links two nucleotides.

This sugar phosphate backbone has an orientation that is denoted by the orientation of the sugars. In Fig. 2.11 (and most of the figures in this book), the chain of nucleotides runs in a 5' to 3' orientation from left to right. In this case, we say that the 5' end is to the left, and the 3' end is to the right.
Three types of shorthand are given in Fig. 2.11. Now the most common shorthand is simply a string of letters (third example), where each letter is the single-letter abbreviation for the base in the nucleotide. Fig. 2.12 shows a chain of nucleotides linked by phosphodiesters.

Figure 2.11.
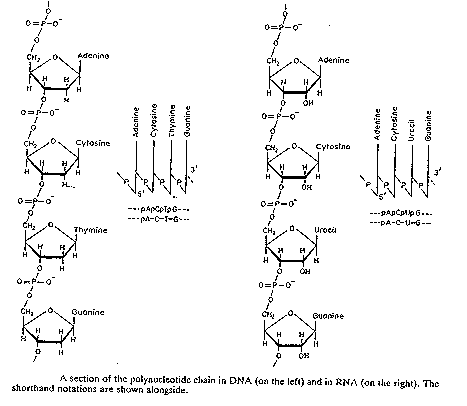
Figure 2.12. Polynucleotide chains in DNA and RNA
Molecular weights
DNA or RNA molecules can vary in size from a few thousand to a many million base pairs, e.g.
polyoma virus 0.6 µm 4,500 bp = 4.5 kb
bacteriophage lambda 17 µm 48,502bp = 48.5 kb
E. coli chromosome 1.5 mm 4,639,221 bp = 4,639.2 kb
D. melanogaster chromos. 20 mm ca. 70,000,000 bp = 70,000.0 kb
(avg) Human chromosome 50 mm 150,000,000 bp = 150,000.0 kb
(or 150 Mb)
Thus nucleic acids can be very long polymers.
Secondary structure of nucleic acids
Base composition analysis of DNA
Based on analysis of the chemical composition of DNA in the early 1950’s, E. Chargaff deduced the following rules about the amounts of the different nucleotides in DNA:
mole fraction of purine nucleotides = mole fraction of pyrimidine nucleotides, or A+G = C+T
mole fraction of keto nucleotides = mole fraction of amino nucleotides, or G+T = A+C
In particular, the mole fraction of aminopurine = that of ketopyrimidine, i.e. A = T,
and the mole fraction of ketopurine = that of aminopyrimidine, i.e. G = C.
These were key observations in deducing the double helical structure of DNA and determining the base-pairing patterns. They helped lead Watson and Crick to the realization that A is complementary to T and G is complementary to C. This could be explained by having two chains, or strands, of DNA paired at the bases.
These ratios do not apply to genomes with single‑stranded DNA or RNA.
B-form DNA
All
thre major forms of DNA are double stranded with the two strands connected by interactions between complementary
base pairs.
The information from the base composition of DNA, the knowledge of dinucleotide structure, and the insight that the X‑ray crystallography suggested a helical periodicity were combined by Watson and Crick in 1953 in their proposed model for a double helical structure for DNA. They proposed two strands of DNA, each in a right‑hand helix, wound around the same axis.
Note:
The term strand of DNA in this
book means a linear chain of nucleotides; each duplex DNA molecule has two
strands. This is a widely used
convention, but conflicts with the classic use of strand to refer to each
daughter of a replicated chromosome, i.e. cytogeneticists would say that a
after replication, each chromosome has two visible strands. A biochemist would say that each
daughter chromosome has a duplex DNA molecule composed of two complementary
strands (for a total of four chains of DNA in the replicated chromosome). This confusion would be avoided if
biochemists and molecular biologists would refer to two chains of nucleotides
in duplex DNA, but unfortunately, this convention has not been adopted. Indeed,
the use of “strand” to refer to one of the complementary chains of nucleotides
in DNA is the common usage, and we will use it frequently in this textbook.
The two strands are held together by H‑bonding between the bases (in anti conformation) as shown in Fig. 2.13.
Major groove Major groove
Minor groove Minor groove
Figure 2.13. An A:T base pair A
G:C base pair
Bases fit in the double helical model if pyrimidine on one strand is always paired with purine on the other. From Chargaff's rules, the two strands will pair A with T and G with C. This pairs a keto base with an amino base, a purine with a pyrimidine. Two H‑bonds can form between A and T, and three can form between G and C. This third H-bond in the G:C base pair is between the additional exocyclic amino group on G and the C2 keto group on C. The pyrimidine C2 keto group is not involved in hydrogen bonding in the A:T base pair.
These are the complementary base pairs. The base‑pairing scheme immediately suggests a way to replicate and copy the the genetic information.
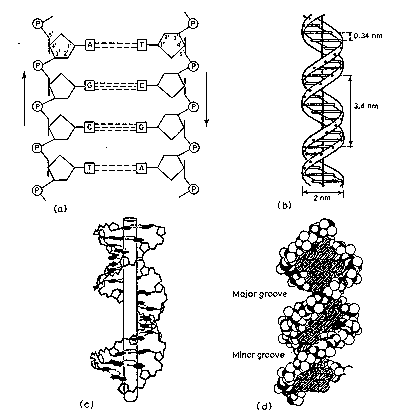
Figure 2.14. Antiparallel (a), plectonemically coiled (b, c, d) DNA strands. The arrows in a are pointed 3’ to 5’, but they illustrate the antiparallele nature of the duplex.
The
two strands of the duplex are antiparallel and plectonemically coiled
The nucleotides arrayed in a 5' to 3' orientation on one strand align with complementary nucleotides in the the 3' to 5' orientation of the opposite strand.
The two strands are not in a simple side‑by‑side arrangement, which would be called a paranemic joint (Fig. 2.15). (This will be encountered during recombination in Chapter 8.) Rather the two strands are coiled around the same helical axis and are intertwined with themselves (which is referred to as a plectonemic coil). One consequence of this intertwining is that the two strands cannot be separated without the DNA rotating, one turn of the DNA for every "untwisting" of the two strands.
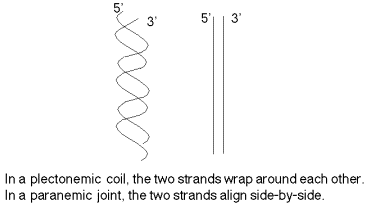
Figure 2.15. Duplex DNA has the two strands wrapped around each other in a plectonemic coil (left), not a paranemic duplex (right).
Dimensions of B-form (the most common) of DNA
0.34 nm between bp, 3.4 nm per turn, about 10 bp per turn
1.9 nm (about 2.0 nm or 20 Angstroms) in diameter
Major
and minor groove
The major groove is wider than the minor groove in DNA (Fig. 2.14d), and many sequence specific proteins interact in the major groove. The N7 and C6 groups of purines and the C4 and C5 groups of pyrimidines face into the major groove, thus they can make specific contacts with amino acids in DNA-binding proteins. Thus specific amino acids serve as H‑bond donors and acceptors to form H-bonds with specific nucleotides in the DNA. H‑bond donors and acceptors are also in the minor groove, and indeed some proteins bind specifically in the minor groove.
Base pairs stack, with some rotation between them.
A‑form nucleic acids and Z‑DNA
Three different forms of duplex nucleic acid have been described. The most common form, present in most DNA at neutral pH and physiological salt concentrations, is B-form. That is the classic, right-handed double helical structure we have been discussing.
A thicker right-handed duplex with a shorter distance between the base pairs has been described for RNA-DNA duplexes and RNA-RNA duplexes. This is called A-form nucleic acid.
A third form of duplex DNA has a strikingly different, left-handed helical structure. This Z DNA is formed by stretches of alternating purines and pyrimidines, e.g. GCGCGC, especially in negatively supercoiled DNA. A small amount of the DNA in a cell exists in the Z form. It has been tantalizing to propose that this different structure is involved in some way in regulation of some cellular function, such as transcription or regulation, but conclusive evidence for or against this proposal is not available yet.
Differences between A-form and
B-form nucleic acid:
The major difference between A-form and B-form nucleic acid is in the conformation of the sugar ring. It is in the C2' endo conformation for B-form, whereas it is in the C3' endo conformation in A-form. As shown in Fig. 2.16, if you consider the plane defined by the C4'-O-C1' atoms of the deoxyribose, in the C2' endo conformation, the C2' atom is above the plane, whereas the C3' atom is above the plane in the C3' endo conformation. The latter conformation brings the 5' and 3' hydroxyls (both esterified to the phosphates linking to the next nucleotides) closer together than is seen in the C2' endo confromation (Fig. 2.16). Thus the distance between adjacent nucleotides is reduced by about 1 Angstrom in A-form relative to B-form nucleic acid (Fig. 2.17).
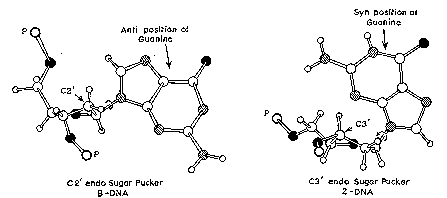
Figure 2.16. Syn and anti conformations of the base relative to the sugar in nucleotides.
A second major difference between A-form and B-form nucleic acid is the placement of base-pairs within the duplex. In B-form, the base-pairs are almost centered over the helical axis (Fig. 2.15), but in A-form, they are displaced away from the central axis and closer to the major groove. The result is a ribbon-like helix with a more open cylindrical core in A-form.
Features of Z-form DNA
Z-DNA is a radically different duplex structure, with the two strands coiling in left-handed helices and a pronounced zig-zag (hence the name) pattern in the phosphodiester backbone. As previously mentioned, Z-DNA can form when the DNA is in an alternating purine-pyrimidine sequence such as GCGCGC, and indeed the G and C nucleotides are in different conformations, leading to the zig-zag pattern. The big difference is at the G nucleotide. It has the sugar in the C3' endo conformation (like A-form nucleic acid, and in contrast to B-form DNA) and the guanine base is in the syn conformation. This places the guanine back over the sugar ring, in contrast to the usual anti conformation seen in A- and B-form nucleic acid. Note that having the base in the anti conformation places it in the position where it can readily form H-bonds with the complementary base on the opposite strand. The duplex in Z-DNA has to accomodate the distortion of this G nucleotide in the syn conformation. The cytosine in the adjacent nucleotide of Z-DNA is in the "normal" C2' endo , anti conformation.
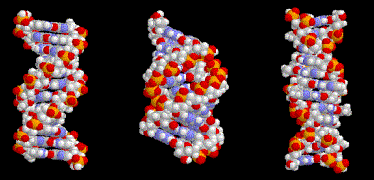
Figure 2.17. B-form (left), A-form (middle) and Z-DNA (right).
Comparisons of B-form, A-form and Z‑DNA
B A Z
helix sense RH RH LH
bp per turn 10 11 12
vertical rise per bp 3.4 2.56 3.7 Angstroms
rotation per bp +36 +33 ‑30 degrees
helical diameter 19 23 18 Angstroms
Even classic B-DNA is not completely uniform in its structure. X-ray diffraction analysis of crystals of duplex oligonucleotides shows that a given sequence will adopt a distinctive structure. These variations in B-DNA may differ in the propeller twist (between bases within a pair) to optimize base stacking, or in the 3 ways that 2 successive base pairs can move relative to each other: twist, roll, or slide.
Denaturation and renaturation: thermodynamics
The stacking interactions between adjacent nucleotide pairs in duplex nucleic acids decreases the UV absorption per nucleotides. Thus the absorbance will increase when the duplex is denatured, meaning the two strands separate. This increase in absorbance is called hyperchromicity.
Denaturation is also referred to as melting, since this transition can be caused by heating. Renaturation is also referred to as annealing; this is favored by cooling to about 20 to 25o C below the melting temperature and by keeping the salt concentration fairly high. The melting temperature is the temperature at which the absorbance has increased by half the final amount. For instance, if the hyperchromic shift is from 1.0 to 1.4, the midpoint of the transition is 1.2, and the temperature at which the absorbance reaches 1.2 is the melting temperature, or Tm.
A related process to renaturation or annealing is hybridization, although this properly refers to the combining of complementary DNA strands from different sources. E.g. one could hybridize a mouse globin gene to a human globin gene; they will form a duplex in the regions where the sequences are quite similar. This is a powerful, simple assay for related DNA or RNA sequences. Only complementary strands of quite similar sequences will hybridize. The higher the similarity, the stronger the duplex and the higher the Tm of the heteroduplex.
Figure
2.18

Factors that affect the melting temperature
a. G+C content: the higher the G+C content, the higher the Tm. G:C base pairs have 3 H-bonds whereas A:T base pairs have only 2, and the base-stacking interactions between G:C base pairs are considerably stronger than those between A:T base pairs.
b. ionic strength (m): The Tm increases as the cation concentration increases. The phosphodiester backbone has a negative charge at every nucleotide (every phosphate) so DNA and RNA are polyanions. These negative charges tend to repel each other, but that repulsion is greatly decreased when each phosphate is surrounded by a cloud of small cations.
A plot of the Tm's for several different DNAs of various G+C content is shown below. Note the linear relationship between Tm and %G+C, and the fact that all the DNAs melt at a lower temperature in a lower ionic strength.

Figure 2.19. Effect of G+C content and ionic strength on melting
temperature.
c. Agents that disrupt H-bonds or interfer with base stacking, such as formamide or urea, will decrease the Tm.
d. One can form hybrids between complementary strands of related but not indentical genes; these are also called heteroduplexes. The melting temperature of these imperfect duplexes (i.e. containing some nucleotides that are unpaired) is reduced, about 1oC for each percent mismatch.
Considerable experimental work led to the following empirical equation that accounts for all the above effects:
Tm = 0.41 (% G+C) + 16.6 log M + 81.5 ‑0.7 (% formamide) ‑1o (% mismatch)
where M = molar concentration of monovalent cation
Extremes of pH, such as pH ≥ 11 or pH < 2.3 will denature DNA, due to the deprotonization or protonization (respectively) of the purine and pyrimidine bases.
Treatment with acids leads to depurination of DNA.
Base (high pH) will hydrolyze phosphodiester bonds in RNA. This base catalyzed reaction needs the 2’-OH for cleavage. Hence the phosphodiester backbone of DNA is stable at elevated pH.
Distinguishing single-stranded (ss) from double-stranded (ds) DNA:
a. Spectrophotometrically
b. Some nucleases are essentially specific for single-stranded nucleic acids. The most commonly used one is nuclease S1 from Aspergillus. Others include mung-bean nuclease. Note that these nucleases will cleave either RNA or DNA, as long as it is single-stranded.
c. HAP (hydroxyapatite) column. Duplex nucleic acids will bind to HAP at room temperature, whereas single-stranded nucleic acids will elute. The duplex fraction can subsequently be retrieved from the column by heating it, melting the nucleic acid and now collecting it as it elutes.

Figure 2.20. Distinguishing between duplex and single-stranded nucleic acids.
Palindromic structures, inverted repeats
A palindrome reads the same forward and backward, e.g.
radar
1991
Able was I ere I saw Elba.
(Pseudo)palindrome in duplex DNA: 5’ GTAACGTCGACGTTAC
CATTGCAGCTGCAATG 5’
In this example, there is dyad axis of symmetry betwen the central CG dinucleotide.
Each strand of a pseudopalindrome is self-complementary. Thus this type of sequence in single-stranded nucleic acid can form a hairpin:
C-G
T-A
Hairpin G-C
C-G
A-T
A-T
T-A
5' G-C... 3'
The pseudopalindrome is an inverted repeat. We also refer to the complementary halves of the pseudopalincrome in single-stranded nucleic acids as inverted repeats. The inverted repeats are not always contiguous. When the inverted repeats are separated by some other sequence, they can form a stem and loop structure (Fig. 2.21).
In double-stranded DNA, pseudopalindromes can form a cruciform.
Although these sequences are properly called pseudopalindromes, usually they are just referred to as palindromes in nucleic acids.
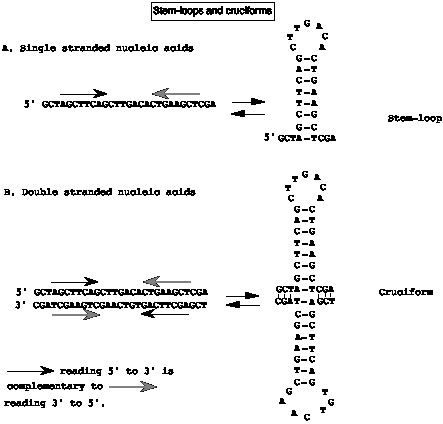
Figure
2.21.
Restriction Endonuclease (Type II) cleavage sites are usually pseudopalindromes.
Eco RI G'AATTC , where '= cut site
CTTAA'G
HindIII A'AGCTT
TTCGA'A
HaeIII GG'CC
CC'GG
RNA pseudoknots are generated when a sequence in a loop (between two stems) forms a duplex with a sequence outside the stem. This occurs in the 3-dimensional structure of tRNA and other RNAs. The pseudoknot forms an almost continuous duplex (with some loops coming off of it) from different regions of the RNA molecule.
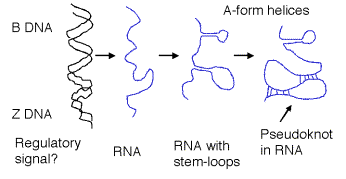
Figure 2.22. Different forms of nucleic acids in a cell.
Some DNA sequences can form triple helical structures, with two strands in held together by Watson‑Crick base pairs, and the third strand strand in Hoogsteen base pairs with one of the first two strands. In the figure below, the purine strand composed of repeating GA dinucleotides is in Watson-Crick base pairs with the 5' end of an antiparallel CT strand, as in normal duplex DNA. The segment of CTs just 5' to this region of the duplex is also hybridized to the GA segment, this time in a parallel orientation (both strands are 5' to 3' left to right) and in Hoogsteen base pairs. This triple helical structure is an example of H‑form DNA. This can form when there are repeating purines on one strand and repeating pyrimidines on the complementary strand, such as (GA)n-(CT)n. Half the purines are in Watson-Crick base pairs with half the pyrimidine strand, and the rest of pyrimidine strand is in Hoogsteen base pairs with the same stretch of purines. The rest of purine strand is single-stranded.
GAGAGA
3'‑‑‑‑‑‑‑/ \
||||||| G
5'‑‑‑‑‑‑‑CTCTCT
/
5'‑‑GAGAGA C
||||||||/
Watson‑Crick bp
3'‑‑CTCTCT
Figure 2.23.
Sedimentation and Electrophoresis: Size and density of DNA and RNA
Sedimentation velocity:
An ultracentifuge can generate very high centrifugal forces, as much as 100,000 times the force of gravity or even greater. When macromolecules are subjected to such high centrifugal forces, they will sediment through a solution at a characteristic rate, and that rate is sufficiently high that the macromolecules will not be randomized by diffusion. That sedimentation rate is primarily a function of two properties of the macromolecule.
(1) The molecular weight - as the molecular weight increases, the sedimentation rate increases.
(2) The shape - the more extended the molecule is, the slower it will sediment. More extended molecules will generate more friction as they move throught the solution, slowing them down, whereas more compact molecules will generate less friction and will sediment faster.
In practice, one prepares a centrifuge tube containing a solution with a gradient in [sucrose], with the higher concentration (greater density) at the bottom. Then one places the sample of nucleic acids on the top of the sucrose gradient in a thin layer (or zone - this technique is sometimes called zonal centrifugation). The sucrose gradients are then spun in an ultracentifuge for a given period of time. If all the molecules have the same shape (e.g. all are linear duplex DNAs or denatured single-stranded RNAs), the larger nucleic acids will sediment faster. More compact molecules will sediment faster than extended molecules of the same size. For instance, a supercoiled duplex circle will sediment faster than a relaxed duplex circle containing the same number of base pairs.
Each molecule has a characteristic sedimentation coefficient, which is the ratio between the sedimentation velocity and the centrifugal force. The value of this coefficient is often the same under many different conditions, and it is taken as a constant that characterizes a molecule. The sedimentation coefficient is usually given in Svedberg units (S), named after the inventor of the ultracentrifuge. Hence different rRNAs are called 28S or 18S or 5S RNA. The Svedberg units are not additive, e.g. combination of the large 50S ribosomal subunit with the small 30S ribosomal subunit produces a 70S ribosome in bacteria.
The sucrose gradient can be calibrated with nucleic acids of a known size so the molecular weight (M) of the sample can be determined. The ratio of the distance moved by the standard molecule (known size and sedimentation coefficient) to the distance moved by the unknown sample molecule is equal to the ratio of their sedimentation coefficients. The sedimentation coefficient determined in this way is dependent on the DNA concentration for large molecules, so this coefficient must be measured at several DNA concentrations and a value called s0 determined by extrapolation to zero concentration. This s0 parameter is directly related to the molecular weight by empirical equations. However, if both the size standards and the molecule of interest are radiolabeled, they can be detected in very low concentrations, and one can measure the molecular weight of the molecule of interest readily. The logarithm of the distance sedimented d is proportional to the log M , so the value of M for the sample of interest can be determined by a plot of log M versus log d for the standards and measuring d for the sample.
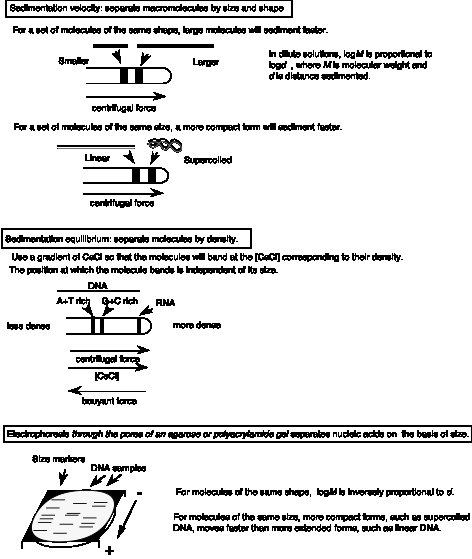
Figure 2.24. Measuring size and density of DNA or RNA.
Sedimentation equilibrium to separate on the basis of density.
Sedimentation equilibrium in a CsCl gradient in an ultracentrifuge will separate nucleic acids on the basis of density, not size. In contrast to sucrose gradient sedimentation, the DNA and/or RNA is dissolved in a solution of CsCl whose density is close to that of the nucleic acids. When spun for suffiently long times (often for greater than one day), the Cs+ and Cl- ions set up a shallow, linear gradient, and the DNA or RNA macrocolecule moves to the position in the gradient that equals its own density. One may consider the macromolecules as moving to an equilibrium position, where the centrifugal force to sediment is balanced by the bouyant force acting against sedimentation.
This technique allows very high resolution separations. E.g. the density gradient may vary from 1.743 g/cm3 at the bottom to 1.687 g/cm3 at the top, and a particular DNA with normal 14N atoms whose density is 1.708 g/cm3 can be separated from DNA of the same size and sequence but whose N are substituted with 15N, giving a density of 1.722 g/cm3.
RNA will band at a higher density than DNA. DNA with a higher mole fraction G+C will band at a higher density than DNA with a lower mole fraction of G+C. Also, in the presence of saturating amounts of the intercalating dye ethidium bromide, supercoiled DNA will bind less dye than does linear DNA. DNA is more dense than ethidium bromide, thus the average density of the DNA-dye complex is greater for supercoiled plasmid (i.e. there is less dye present per unit length of DNA). Therefore supercoiled plasmids will band at a higher density ("the lower band") in a CsCl gradient with saturating concentrations of ethidium bromide.
Gel electrophoresis
This is now by far the most common way to determine sizes of macromolecules, whether they are proteins or nucleic acids.
In an electric field, charged molecules will move toward the electrode of the opposite charge, i.e. negatively charged DNA or RNA will move to the positive electrode. The rate at which the molecules move depends on its charge density and shape - as in sedimentation velocity, more extended molecules have greater frictional resistance which tends to slow them down. DNA and RNA have a constant charge density (one negative charge per nucleotide). Duplex linear DNA has a roughly constant shape, i.e. a very long cylinder with occassional bends. Denatured RNA (i.e. with no secondary structure) has an essentially constant shape. Thus in the absence of a matrix, one would see very little separation of nucleic acids by electrophoresis.
However, samples of DNA or RNA are electrophoresed through either an agarose or polyacrylamide gel matrix. The extended nucleic acid molecules have to find their way through the network of pores in the matrix, with the result that small molecules will move more quickly through the gel. That is, in an electric field the mobility of these molecules with a constant charge density is determined by its ability to penetrate the pores of the gel. For a set of linear DNA fragments, smaller fragments move faster (Fig. 2.25). The distance migrated d is an inverse function of the log of the molecular weight (M), or length.
d = a - blogM
where a and b are emprically measured constants that depend on the buffer, the concentration of the matrix compound in the gel, and the temperature.
In practice, one runs size standards in the gel along with the samples of interest and constructs a calibration curve for d versus logM for the standards. The size of the samples of interest can be determined by measuring d and reading M from the calibration curve.
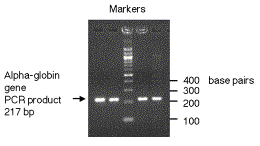
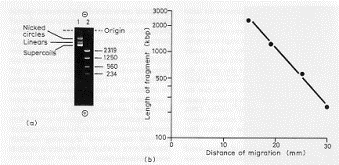
Figure 2.25. Fragments of DNA move through electrophoretic gels as a logarithmic function of their lengths.
Pore sizes in agarose gels are larger than in polyacrylamide, so agarose gels are better for separating larger DNA fragments (1‑50 kb). Polyacrylamide gels are useful for separating 20‑1000 bp. The higher the concentration of the agarose, the smaller the average pore size, so smaller fragments are better resolved at higher agarose concentrations. Similarly, increasing the amount of acrylamide or of the bis-acrylamide cross-linker in the polyacrylamide gel will produce smaller pores and better resolution of smaller fragments.
Very large DNA fragmens, in the mega‑base size range, can be separated on pulsed‑field agarose gels, in which the electric field is reversed with a frequent periodicity so the DNA molecules change their orientation frequently and pass through the pores in the gel.
Supercoiled DNA migrates faster than linear or relaxed circles (Fig. 2.25).
A similar technique is used to measure the molecular weight of proteins. Proteins vary greatly in their charge density and shape, and can be resolved on non-denaturing, or native gels. However, such separations are not dependent on M. By denaturing the proteins in the presence of the detergent sodium dodecyl sulfate (SDS) and a thiol to reduce disulfide bonds, a set of proteins assumes a constant charge density (from the negative charge on the SDS, which has bound at about 1 detergent molecule per amino acid), and a random coil shape (from the combined effects of the detergent and the thiol to unfold the protein). Now the denatured proteins will migrate in an SDS-polyacrylamide gel such that the distance moved d is inversely proportional to the log M.
Restriction maps of DNA molecules
The map of cleavage sites for restriction endonucleases is one of the most common maps, or sets of markers, used in analysis of DNA. We will examine two ways to construct such maps. Identifying sequences in certain restriction fragments by virtue of their ability to hybridize to a known probe is another extremely useful technique; this is usually done as a Southern blot-hybridization.
Double digests are a common way to construct restriction maps.
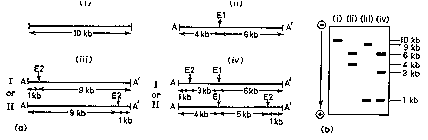
Figure 2.26. Use of double digests to construct a restriction map.
Partial digests are another way.
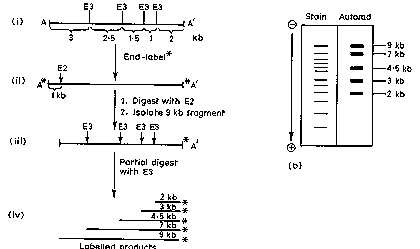
Figure 2.27. Use of partial digests to determine a restriction map.
Southern blot-hybridizations
After separation by electrophoresis, DNA fragments are transferred to a membrane (nylon or nitrocellulose) and immobilized; this replica of the DNA pattern in the gel is called a "blot." A specific labeled probe is hybridized to the blot to detect related sequences. After nonspecifically bound probe is washed away, the specific hybrids are detected by autoradiography of the blot.
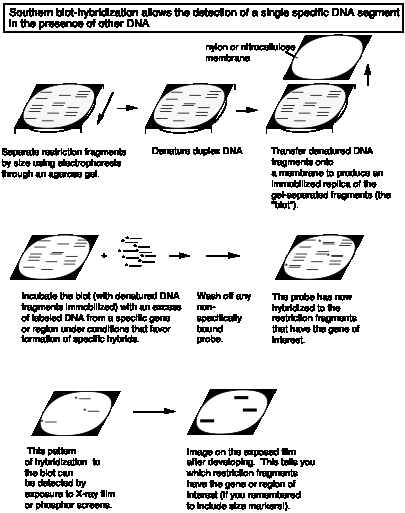
Figure 2.28. Southern blot-hybridization allows detection of a single, specific DNA segment in the presence of other DNA.
Restriction sites can be used as genetic markers. One can identify restriction fragment length polymorphisms (RFLPs) that are linked to a particular locus. This can be be used to
(1) Develop a diagnostic test for a disease locus (e.g. sickle cell disease)
(2) Help isolate the gene.
(3) DNA fingerprinting for highly variable loci.
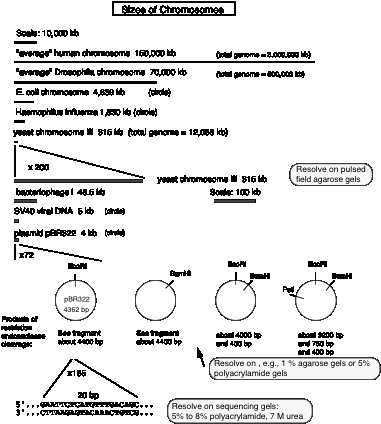
Sizes of DNAs and chromosomes, and methods to resolve them
The next figure presents views of chromosomes and DNA segments on four different, expanding scales. The top level compares the sizes of intact chromosomes from four of the organisms we will be discussing in this course. The scale on yeast chromosome III is then expanded so that it can be compared to some of the viral and plasmid genomes that are in common use. Next, a higher resolution view of the plasmid pBR322 is given, and finally the highest resolution that we are usually concerned with, i.e. the nucleotide sequence.
Figure
2.29.
Determining the sequence of DNA and RNA
The basic approach is to generate a nested set of DNA fragments that start a common site and end in either A, G ,C or T. These sets of (labeled) DNA fragments are separated on a denaturing polyacrylamide gel that has a resolution of 1 bp. The resulting pattern allows the sequence to be read. Base-specific chemical modification and degradation, developed by Maxam and Gilbert, was a widely used approach. Nucleotide-specific cleavage of RNA by a set of Rnases can be used to sequence RNA. We will focus on the most common method of sequencing DNA, that of nucleotide-specific chain termination.
The dideoxynucleotide chain termination method was developed in the laboratory of Fred Sanger at Cambridge. A 2’, 3’ dideoxynucleotide can be incorporated into DNA, as directed by the template strand. However, the missing 3’-OH precludes further polymerization. Hence the newly synthesized chain of nucleotides ends at base-specific, chain terminating dideoxynucleotide. Reactions are run such that all the products end in a G, a C, an A, or aT, but they all begin at the same place. This generates a nested set of products whose length is a measure of the position of all G’s in a target sequence, or all C’s, etc. Thus one can deduce that the target sequence is complementary to, e.g. G at position 1, T at positon 2, C at positions 3 and 4, etc. for hundreds of nucleotides per run.
In more detail, a specific primer is annealed to the template, upstream from the region to be sequenced. DNA polymerase will catalyze the synthesis of new DNA from the 3' end of that primer (elongation). The primer therefore generates a common end to all the product fragments. (This is the basis for the nested set in this approach).
The synthesized DNA is labeled with either a radioactive nucleotide, such as [a35S]deoxy‑thio‑ATP, or a fluorescent dye, often attached to the primer.
A base-specific chain‑terminator is included in each of four reactions:
2',3' dideoxyGTP in the "G" reaction.
2',3' dideoxyATP in the "A" reaction.
2',3' dideoxyTTP in the "T" reaction.
2',3' dideoxyCTP in the "C" reaction.
The DNA polymerase will elongate from each annealed primer until it incorporates a 2', 3' dideoxynucleotide. No additional nucleotides can be added to this product, since it has no 3' OH, thus it is a chain-terminator. This termination occurs only at G residues (complementary to C's in the template) in the "G" reaction, only at A residues in the "A" reaction, etc. Thus the products of each reaction comprise a nested set of fragments, with the specific primer at the 5' end and the base-specific chain terminator at the 3' end. The products are resolved on a sequencing gel, exposed to X-ray film and the sequence read, as in Fig. 2.30.
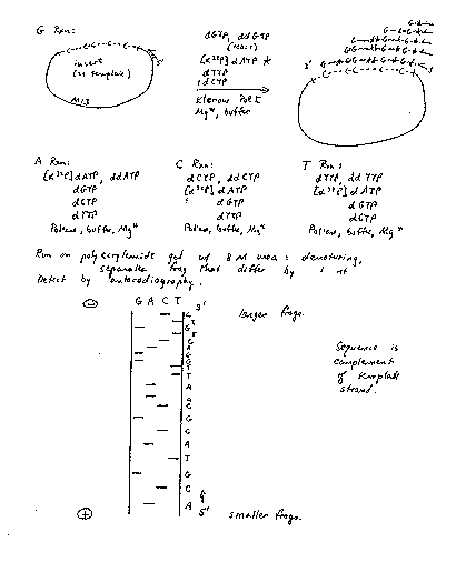
Figure 2.30. Sanger dideoxynucleotide chain termination sequencing.
The dideoxynucleotide chain-termination approach is the method used in automated sequenators. Different color fluorescent dyes (usually attached to the primer) are included in each base-specific reaction. Therefore the products of all four can be run in 1 lane of the resolving gel, allowing >20 sequencing sets to be analyzed at one time. A laser scans continuously along one zone of the gel, and records when a (e.g.) red, green, blue or yellow fluoresence is detected in each lane, meaning that the primer extended to a (e.g.) A, G, C or T is passing through the detection zone. These data are automatically processed, and a readout is generated with the peaks for each fluorescent dye as function of time of the gel running and the deduced sequence. An example of the output is shown below in black-and-white; the original output is in color (a different color for each nucleotide). Manual editing of the deduced sequence can be done based on the raw data, but in large scale sequencing projects, each region is determined about 8 different times and other software is used to determine the most frequently ocurring nucleotide at each position.
The capacity of automated sequencing machines is extraordinary. New machines using capillary gel electrophroesis are used to generated millions of nucleotides per day in the major sequencing centers. This technology allows large, complex genomes to be sequenced rapidly, as discussed in Chapter 4.
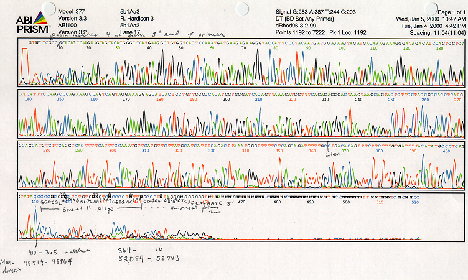
Figure 2.31. Example of output from automated dideoxynucleotide sequencing.
Supercoiling of topologically constrained DNA
Topologically closed DNA can be circular (covalently closed circles) or loops that are constrained at the base.
The coiling (or wrapping) of duplex DNA around its own axis is called supercoiling (Fig. 2.32 middle).
Negative supercoils twist the DNA about its axis in the opposite direction from the clockwise turns of the right-handed (R-H) double helix.
Negatively supercoiled DNA is underwound (and thus favors unwinding of duplex).
Negatively supercoiled DNA has R-H supercoil turns (Fig. 2.32).
Positive supercoils twist the DNA in the same direction as the turns of the R-H double helix.
Positively supercoiled DNA is overwound (helix is wound more tightly).
Positively supercoiled DNA has L-H supercoil turns.
The clockwise turns of R-H double helix (A or B form) generate a positive Twist (T); see Fig. 2.32 left.
The couterclockwise (ccw) turns of L-H helix (Z ) generate a negative T.
T = Twisting number
For B form DNA, it is + (# bp/10 bp per twist)
For A form DNA, it is + (# bp/11 bp per twist)
For Z DNA, it is - (# bp/12 bp per twist)
W = Writhing Number is the turning of the axis of the DNA duplex in space
Negative supercoils, W is negative
Positive supercoils, W is positive
L = Linking number = total number of times one strand of the double helix (of a closed molecule) encircles (or links) the other.
L
= W + T
L cannot change unless one or both strands are broken and reformed.
A change in the linking number, DL, is partitioned between T and W (Fig. 2.32 right). Thus:
DL=DW+DT
if DL = 0, DW=-DT
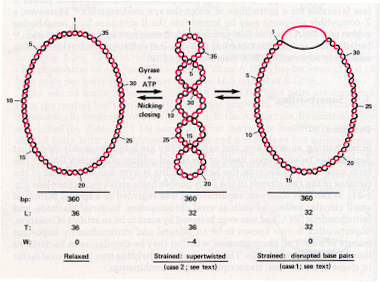
Figure 2.32. Relationship between supercoiling and twisting.
Ethidium Bromide intercalates in DNA, and untwists (or unwinds) the duplex by -27o per molecule of ethidium bromide intercalated. Thus intercalation of 14 molecules of ethidium bromide will untwist the duplex by 378o, i.e. slightly more than one full twist (which would be 360o).
For this process of intercalation, DL=0, since no covalent bonds in the DNA are broken or reformed. The change in twist, DT, is negative, and thus DW is positive. Thus intercalation of ethidium bromide can relax a negatively supercoiled circle, and further intercalation will make the DNA positively supercoiled (Fig. 2.33).
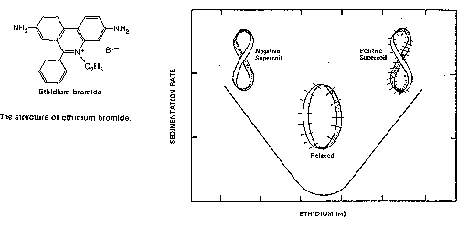
Figure 2.33.
It is useful to have an expression for supercoiling that is independent of length. The superhelical density is simply the number of superhelical (S.H.) turns per turn (or twist) of double helix.
Superhelical density = s = W/T = -0.05 for natural bacterial DNA
(calculated from 1 negative S.H. turn per 20 twists = 1 negative S.H. turn per 200 bp)
Negative supercoiled DNA has energy stored that favors unwinding, or a transition from B-form to Z DNA.
For s = -0.05, DG=-9 Kcal/mole favoring unwinding
Thus negative supercoiling could favor initiation of transcription and initiation of replication.
Topoisomerases
Topoisomerases catalyze a change in the linking number of DNA.
Topo I = nicking-closing enzyme, can relax positive or negative supercoiled DNA, makes a transient break in 1 strand
E. coli Topo I specifically relaxes negatively supercoiled DNA. Calf thymus Topo I works on both negatively and positively supercoiled DNA.
Topo II = gyrase: uses the energy of ATP hydrolysis to introduce negative supercoils. Its mechanism of action is to make a transient double strand break, pass a duplex DNA through the break, and then re-seal the break.
Measuring a change in linking number
One can measure a change in linking number (DL) by sedimentation, electrophoresis, or electron microscopy, as illustrated in Fig. 2.34.
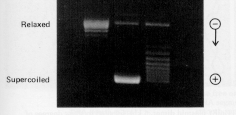
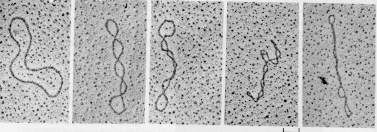
Figure 2.34.
QUESTIONS
CHAPTER 2
STRUCTURES OF
NUCLEIC ACIDS
2.1 What fraction of the volume of the nucleus is occupied by DNA in a typical mammalian cell? The diploid genome size is about 6 billion base pairs. Assume the DNA is all in B form and is essentially cylindrical. The radius of an average mammalian nucleus is about 2.5 micrometers; assume the nucleus is a sphere.
2.2 DNA from thebacteriophage M13 has a base composition of 23% A, 36% T, 21% G, and 20% C.
a. Is the DNA from the phage single-stranded or double stranded?
b. The replicative form, which is the template for new viral DNA synthesis in an infected cell, is double stranded. What is its base composition?
2.3 Write down any string using the letters A, G, C and T. Consider this a single strand of DNA. You can stop after 10 or 20 letters. What is its base composition? What is the base composition of the duplex form?
2.4 Structural basis for pairing between bases in nucleotides.
Use these "skeletons" of purines and pyrimidines to draw the following base pairs. You will need to add the correct amino and keto groups, add some double bonds to the rings, and indicate the correct H-bonds.
a) A G-C base pair:

b) An A-T base pair:

c) Now try to draw a base pair between G and T, with T in the usual keto tautomer. What has to be done to get H-bonds between the purine and pyrimidines with these structures?

d) Let the T shift to the enol tautomer, and now try to draw a base pair between G and enol-T. What does this tell you about potential roles in mutations of the enol-keto tautomerization? What would be the impact of trying to build a DNA structure with the enol rather than keto tautomers?

2.5 Antiparallel Polarity of Strands of DNA.
In their 1953 paper presenting a model for DNA structure, Watson and Crick hypothesized that the two complementary strands of DNA were in opposite polarity, or antiparallel. As they stated, “...the sequences of the atoms in the two chains run in opposite directions.” In the usual conventions for writing DNA sequences, this means that the sequence of the top strand would be arrayed from 5’ to 3’ as one reads from left to right. Consequently, one usually reads the bottom strand from right to left.
Experimental evidence for this antiparallel polarity came from a nearest neighbor analysis, developed by A. Kornberg and his colleagues. The predicted relationships among the nearest neighbor frequencies are different for models in which the two strands of DNA have the same or the opposite polarity. Consider the two structures below; these differ only in the polarity of the complementary strands.
Same polarity:
5’ pTpApGpApC 3’
5’ pApTpCpTpG 3’
Opposite polarity:
5’ pTpApGpApC 3’
3’ pApTpCpTpG 5’
In both cases, T forms a base pair with A and G forms a base pair with C (and vice versa), following the usual Watson-Crick hydrogen bonding pattern.
a) What relationships do you predict for the nearest neighbor frequencies (or dinucleotide frequencies) for the two models? For example, with the same polarity, one expects the frequency of ApG to be equal to that of TpC (both written from 5’ to 3’), whereas the model for opposite polarity predicts that the frequency of ApG should equal that of CpT.
b) Kornberg’s analysis of the nearest neighbor frequencies in Micrococcus phlei gave the results shown below. This bacterium has a double stranded DNA genome.
Do these data support a parallel or antiparallel polarity (same or opposite orientation for the complementary strands), and why?
|
Dinucleotide |
Frequency of Occurrence |
|
TpA ApA CpA GpA TpT ApT CpT GpT TpG ApG CpG GpG TpC ApC CpC GpC |
0.012 0.024 0.063 0.065 0.026 0.031 0.045 0.060 0.063 0.045 0.139 0.090 0.061 0.064 0.090 0.122 |
c) Kornberg and his colleagues were able to determine nearest neighbor frequencies by the following procedure. A DNA template was replicated in vitro using DNA polymerase I from E. coli and all four dNTPs. In one reaction, the dATP was labeled with 32P on the a phosphate (abbreviated [a32P]dATP). As we examine in more detail in Part Two of the course, when the dATP is incorporated into the growing DNA chain, the a phosphate remains, still attached to the 5’ carbon of deoxyribofuranose via an ester linkage, and the b and g phosphates are released as pyrophosphate. Thus the product DNA was labeled at every A residue, on the phosphate that is 5’ to the A. Three other reactions contained [a32P]dGTP, [a32P]dTTP, or [a32P]dCTP, respectively, to obtain DNA labeled at every G, T, or C residue. The product DNA was then digested to mononucleotides using a combination of micrococcal nuclease and spleen phosphodiesterase, both of which cleave the phosphodiester backbone between the phosphate and the 5’ carbon of the deoxyribofuranose, producing deoxynucleoside-3’-monophosphates.
(c.1.) What has happened to the 32P phosphate as a result of this procedure?
(c.2.) After labeling in vitro synthesized DNA from M. phlei with [a32P]dATP, label was found in the four 3’-deoxyribonucleotides at the following frequencies.
T 0.075
A 0.146
C 0.378
G 0.401
These data provide information on the frequency of occurrence of what four dinucleotides?
(c.3.) The mole fraction of A in M. phlei is 0.162. What are the frequencies of occurrence of the four dinucleotides in problem c.2?
2.6 Which of the following statements about various DNA helical structures are true and which are false?
a) Adjacent nucleotide pairs in B form DNA are stacked directly over each other.
b) Duplex nucleic acid in the A form has 11 base pairs per turn.
c) Guanidylate residues in Z DNA are in the syn conformation.
2.7 Are the following statements about DNA true or false?
a) DNA with a high G+C content will melt at a higher temperature than will DNA with a low G+C content.
b) DNA with a high G+C content will band at a lower density on a CsCl gradient than will DNA with a low G+C content.
c) An increase in ionic strength will decrease the melting temperature of DNA.
2.8 You are comparing the sedimentation behavior of the DNA from two phage, A and B, and obtain the results shown below.

a) What do you conclude about their relative sizes and base compositions?
b) Draw melting curves for the DNAs from A and B.
2.9 A homogenous preparation of DNA (one type of molecule) was digested with restriction endonucleases and the fragmentation pattern analyzed by gel electrophoresis. The pattern of fragments is shown in the figure below. The restriction endonucleases used to digest the DNA are shown at the top of each lane. 0 = no enzyme digestion, B = BamHI, E = EcoRI, P = PstI, H = HindIII. Sizes are given in kb (kilobase pairs).

a) Is the DNA molecule linear or circular?
b) Which nuclease(s) cut the DNA?
c) Which nuclease(s) do not cut the DNA?
d) What is the map of restriction endonuclease cleavage sites? Show the positions of the sites and the distance between them in kb.
2.10 Use of RFLPs to map human disease genes.
Restriction fragment length polymorphisms can be used to map human disease genes. Genetic maps of humans have been assembled with polymorphic markers on average about 10 cM apart, and higher resolution maps are being made now. Finding markers (anonymous or otherwise) that map closer and closer to the disease locus provides a major avenue to localizing the disease gene. Probes flanking the region can be used to start chromosomal walks, isolating clones of genomic DNA that cover the region of interest. Candidate genes are then identified by mapping regions that produce mRNA, and these are examined more closely to find the disease gene. Definitive evidence comes from showing that a particular candidate gene is mutated in the disease state.
This problem is designed to show how one tests whether a particular polymorphism is linked to the disease gene. This is best illustrated by examples, and I have adapted a problem from the textbook Genetic Analysis (by Griffiths, Miller, Suzuki, Lewontin and Gelbart) that show specific examples. The problem shows data on a polymorphism associated with Huntington’s disease, and illustrates the fact that different families may have different polymorphisms that associate with the disease.
The process of mapping a disease gene involves testing hundreds of polymorphic markers for association with the disease in informative pedigrees. And getting close in terms of recombination distances is still pretty far away in molecular terms. The probe G8 in the Huntington’s disease (HD) example is still 5 cM away from the disease locus (see part e). A cM corresponds to roughly 1 Mb (1x10⁶bp), at least for some parts of human chromosomes, so the investigators using the G8 probe were still approximately 5 Mb away from the HD. The HD gene has been cloned. It encodes a protein, called huntingtin, of predicted molecular mass of 348 kDa, whose function is currently unknown. The mutation is an expansion of trinucleotide repeats, as is Fragile X and several other mutations causing human diseases.
Huntington’s disease (HD) is a lethal neurodegenerative disorder that exhibits autosomal-dominant inheritance. Because the onset of symptoms is usually not until the third, fourth, or fifth decade of life, patients with HD usually have already had their children, and some of them inherit the disease. There had been little hope of a reliable pre-onset diagnosis until a team of scientists searched for and found a cloned probe (called G8) that revealed a DNA polymorphism (actually a tetramorphism) relevant to HD. The probe and its four hybridizing DNA types are shown here; the vertical lines represent HindIII cutting sites:
Extent of homology to G8 probe .
| 17.5 | 3.7 | 1.2 | 2.3 | 8.4 | DNA A
| 17.5 | 4.9 | 2.3 | 8.4 | DNA B
| 15.5 | 3.7 | 1.2 | 2.3 | 8.4 | DNA C
| 15.5 | 4.9 | 2.3 | 8.4 | DNA D
a) Draw the Southern blots expected from the cells of people who are homozygous (AA, BB, CC, and DD) and all who are heterozygous (AB, AC, and so on). Are they all different?
b) What do the DNA differences result from in terms of restriction sites? Do you think they are probably trivial or potentially adaptive? Explain.
c) When human-mouse cell lines were studied, the G8 probe bound only to DNA containing human chromosome 4. What does this tell you?
d) Two families showing HD -- one from Venezuela, and one from the United States -- were checked to determine their G8 hybridizing DNA type. The results are shown in the pedigree below, where solid black symbols indicate HD and slashes indicate family members who were dead in 1983. What linkage associations do you see, and what do they tell you?
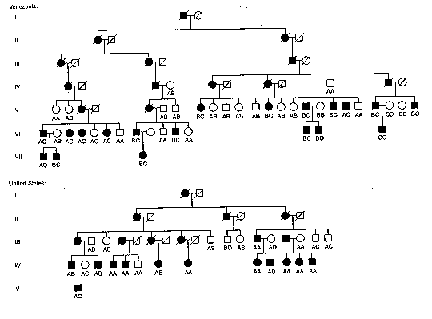
(e) How might these data be helpful in finding the primary defect of HD?
(f) Are there any exceptional individuals in the pedigrees? If so, account for them.
2.11 A mixture of nucleic acids, each of which has the same number of nucleotides or base pairs, was banded on a CsCl density gradient. Component I was at the bottom of the gradient, and component II was about halfway down the gradient. Component II separated into two fractions after velocity sedimentation in 0.1 M NaCl, one fast (IIF) and one slow (IIS). What kind of nucleic acid is each component, and what can you tell about their topological isomers?
2.12 DNA supercoiling.
Consider a covalently closed circular DNA molecule that is 400 bp long in the B conformation with two negative superhelical turns. For this molecule:
a) What is T = twisting number?
b) What is W = writhing number?
c) What is L = linking number?
2.13 (POB) A covalently closed circular DNA molecule in B form DNA has a linking number, L, of 500 when it is relaxed. Approximately how many base pairs are in this DNA? How will the linking number be altered (increase, decrease, no change, become undefined) if
a) a protein complex is bound to form a nucleosome,
b) one DNA strand is broken,
c) DNA gyrase is added with ATP, or
d) the double helix is denatured (base pairs are separated) by heat?
2.14 A negatively supercoiled DNA molecule undergoes a B to Z transition over a segment of 120 base pairs. What is the effect on the writhing (supercoiling)?
2.15 How many molecules of ethidium bromide are needed to relax a circular DNA molecule that originally had 5 negative supercoils, i.e., go from
W = -5 to W = 0?
2.16 A mixture of double-stranded DNA molecules, some linear and some covalently-closed, circular, and supercoiled, were banded by centrifugation in a CsCl density gradient in the presence of a saturating concentration of ethidium bromide. Which statement accurately describes the position of the DNA molecules in the gradient? The molecules have the same G+C content.
a) The circular, supercoiled DNA bands below the linear DNA (i.e. circles are more dense).
b) The circular, supercoiled DNA bands above the linear DNA.
c) The linear and circular, supercoiled DNAs band at the same position.
d) The ethidium bromide forms a pellet at the bottom of the gradient.