CHAPTER 6
DNA REPLICATION II:
Start, Stop and Control
This chapter explores some of the ways in which DNA replication is controlled.
Regulation is largely exerted at the initiation of replication, and methods for finding origins and termini of replication will be covered. The proteins involved in control of replication initiation in E. coli and yeast will be discussed. One solution to the problem of completing the synthesis of linear DNAs in eukaryotes will be described - that of making telomeres. Some of the factors controlling the rate of initiation of replication will be discussed briefly.
Stages of DNA synthesis
The synthesis of any macromolecule proceeds in three stages: initiation, elongation and termination. This is true for DNA replication as well. During initiation, DNA synthesis begins at a specific site, called an origin of replication. The circular E. coli chromosome has a single origin, called oriC. Many bacteria have circular chromosomes with single origins of replication. However, other chromosomes, especially those in eukaryotes, can have multiple origins. During elongation, nucleotides are added to the growing DNA strand as the replication fork moves along the chromosome. Termination are the final steps that occur when all or an appropriate portion (replicon, see below) of the chromosome has been replicated.
The primary control of replication is exerted during initiation. This is economical, of course, since little benefit would come from initiating replication that will never be completed. As will be covered later in this chapter, an examination of the DNA structures, proteins and enzymes needed for initiation show that it is highly regulated. Initiation is an active process, requiring the accumulation of ATP-bound DNA binding proteins at a specific site prior to the start of replication. Both the activity of the initiator proteins and the state of covalent modification of the DNA at the origin are part of the control process.
The replicon
It is critical that all the DNA in a cell be replicated once, and only once, per cell cycle. Jacob, Brenner and Cuzin defined a replicon as the unit in which the cell controls individual acts of replication. The replicon initiates and completes synthesis once per cell cycle. Control is exerted primarily at initiation. They proposed that an initiator protein interacted with a DNA sequence, called a replicator, to start replication. The replicator can be identified genetically as a DNA sequence required for replication, whereas the origin is defined by physical or biochemical methods as the DNA sequence at which replication begins. For many replicons, such as the E. coli oriC and the autonomously replicating sequences (or ARS) in yeast, the replicator is also an origin. However, this need not be the case: the replicon for amplified chorion genes in silkmoths has an origin close to, but separable from, the replicator. Initiator proteins have now been identified for some replicons, such as the DnaA protein in E. coli and the Origin Recognition Complex in the yeast Saccharomyces cerevisiae. In both cases, they bind to the replicators, which are also origins in these two species.
The replicator is a sequence of DNA needed for synthesis of the rest of the DNA in a replicon. It is a control element that affects the chromosome on which it lies. We say that this element acts in cis, since the replicator and the replicon are on the same chromosome. In contrast, the initiator is a protein that can be encoded on any chromosome in a cell. Thus is acts in trans, since it does not have to be encoded on the same chromosome as the replicon that it controls. In general, a trans-acting factor is an entity, usually a protein, that can diffuse through the cell to act in regulation of a certain target, whereas a cis-acting DNA sequence is on the same chromosome as the target of control. This pattern of a trans-acting protein binding to a cis-acting site on the DNA is also seen in transcriptional control.
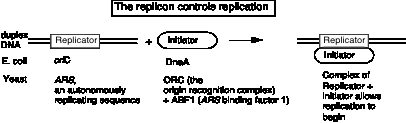
Figure 6.1. Components of a replicon, the unit in which
the cell controls repliation.
Question 6.1. Although E. coli has a single origin in a single replicon, eukaryotic chromosomes have multiple origins, and multiple replicons. Consider a line of mammalian cells growing in culture that has an S phase of 5 hr, i.e. all the genome is replicated in 5 hr. The haploid genome size is 3 x 10⁹ bp. If the rate of replication fork movement in this cell lines is 2000 bp per min, how many replication origins are required to replicate the entire haploid genome during S phase? Assume that two replication forks emerge from each origin (this is bidirectional replication, see below).
Experimental approaches to map origins and termini of replication and to distinguish between uni‑ and bidirectional replication
Several experimental techniques have been established for finding where replication begins and ends on chromosomes, and for distinguishing between unidirectional and bidirectional replication. We will cover two major techniques.
Structural analysis of pulse-labeled DNA
molecules
One approach is to label the newly synthesized DNA in an asynchronous population of DNA molecules for short periods of time (called pulse-labeling), isolate completed DNA molecules and then monitor the appearance of radioactive label in particular restriction fragments. Since the molecules are not replicating synchronously, some of the DNA molecules will be completed during a short pulse label, and the others will incorporate the radiolabel internally. As shown in Fig. 6.2, those DNA molecules that completed replication during the short pulse label will have radioactive label in the restriction fragment containing the terminus of replication. When the replicating molecules are labeled for a longer time (longer pulse), the completed DNA molecules will have radioactive label not only in restriction fragments containing the terminus, but also in adjacent fragments. The origin of replication will only be labeled with the pulse time is extended to the period required for complete synthesis of the DNA molecule. Thus in this procedure, when asynchronously replicating molecules are labeled for a series of pulse periods of increasing length and completed DNA molecules examined at the end of each pulse, the the terminus of replication will be labeled at the earliest time points, whereas those containing an origin will be labeled last.
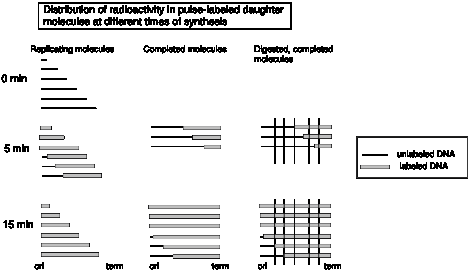
Figure 6.2. Distribution of radioactivity in pulse-labeled daughter DNA molecules at different times of synthesis. The thin black horizontal lines represent unlabeled, replicating DNA molecules at various stages of completion. The origin (ori) is at the left and the terminus (term) is at the right. The thick gray lines are radioactively labeled portions of the replicating DNA molecules. After a 5 min pulse, some of the DNA molecules shown at time 0 have completed synthesis. These are collected, digested with a restriction endonuclease at the sites marked by vertical lines. Note that the restriction fragments containing the terminus of replication will have radioactive label after a short pulse. In the third panel, the results of a longer pulse labeling period is shown. The labeling time has been long enough for molecules that initiated synthesis after addition of the radioactive label to complete synthesis. These latter molecules will have label in restriction fragments containing the origin. Hence in this protocol, label appears in restriction fragments containing the origin only at longer pulse periods.
This concept came from an approach used by Dintzis to measure the direction of protein synthesis in the mid-1960’s (see Chapter V in Part Three). It can be confusing, so let’s try an analogy. Imagine that 20 students are writing essays using word processors set to use black letters. They are all at different stages of completing their papers, and they are not revising or editing their essays – just writing them from start to finish. At a defined time, all the word processors are switched to using red letters. As each student completes their paper, they print them out and turn them in. Essays by students who were almost finished when the font color was switched will have red text only at the end. Essays by students who were half-way through their essay when the the color was switched will have red text for the last half. Those by students who were just beginning their essays when the letter color was switched will have red text throughout, including the beginning. The switch of letters to red is analogous to the pulse labeling of DNA molecules with radioactivity. Just as the essays completed shortly after the color change will red text only at the end, so DNA molecules that finish replication during a short pulse label will have radioactive label at their terminus.
Once restriction enzymes had been discovered in the early 1970's, Dana and Nathans realized that they could use them to divide the mammalian polyoma virus, simian virus 40 (SV40) into discrete fragments. They used the following pulse-labeling procedure to identify the origin and termini of viral DNA synthesis. Monkey cells growing in culture were infected with SV40 and then pulse-labeled with [3H]thymidine for 5, 10 and 15 min. Completed viral DNA molecules were isolated, digested with restriction endonucleases from H. influenza (a mixture of HindII and HindIII), separated on a polyacrylamide gel, and the amount of [3H] incorporated into the DNA was determined. To normalize for the different sizes and base compositions of the restriction fragments, the [3H] counts were divided by the amount of [32P] in the same restriction fragments from DNA uniformly labeled with [32P]phosphate. As discussed above, when the length of the pulse-label is shorter than the time required to the complete synthesis of the DNA molecule, the label will first appear in the fragments closer to the terminus. As the pulse-labeled (newly synthesized) DNA appears in completed DNA molecules, a gradient of label was observed across the completed molecules, as shown in the following figures and table adapted from their paper.
Figure 6.3 Restriction map of
SV40

Table 6.1. Appearance of radiolabel into restriction fragments of completed SV40 DNA molecules. The relative amount of pulse label from each restriction fragment is given below (the relative amount of pulse label is the 3H/32P ratio of each fragment, corrected for thymidine content and normalized to 1 for fragment A).
|
|
Relative amount of pulse label |
|
|
||
|
Fragment |
5 min |
10 min |
15 min |
|
|
|
A |
1.0 |
1.0 |
1.0 |
|
|
|
B |
3.9 |
3.0 |
2.3 |
|
|
|
C |
0 |
0.75 |
0.75 |
|
|
|
D |
0.92 |
0.86 |
1.1 |
|
|
|
E |
1.8 |
2.0 |
1.7 |
|
|
|
F |
4.0 |
3.1 |
2.4 |
|
|
|
G |
5.4 |
4.2 |
2.6 |
|
|
|
H |
1.7 |
2.5 |
2.0 |
|
|
|
I |
2.7 |
3.0 |
2.2 |
|
|
|
J |
4.9 |
3.7 |
2.6 |
|
|
|
K |
2.4 |
2.9 |
1.9 |
|
|
When the data on amount of pulse label in the Table is viewed with the restriction map of SV40, a clear pattern is seen. The temporal order of synthesis correlates well with the physical orders of the fragments along the chromosome. As Danna and Nathans expressed it, "there is a consistent gradient of labeling, indicating a specific order of synthesis of different parts of the SV40 DNA molecule. Since newly completed molecules were analyzed, fragments with the lowest amount of pulse label (C and D) are from that part of the DNA synthesized first. Fragments with the highest amount (G and J) are from that part of the DNA synthesized last."
Not only do these data identify the region of the chromosome with the origin (fragments C and D) and the the region with the terminus (fragments G and J), but one can also see that replication is bidirectional from that origin. The gradient of labeling is about the same on both "halves" of the SV40 genome (going either clockwise or counterclockwise from the C-D region), indicating bidirectional replication, with approximately equal rates of synthesis for the two forks.

Figure 6.4.A.
A plot of the relative amount of pulse label as a function of distance from the A-C junction illustrates the similarity in the gradient of labeling in the two halves of the molecule.
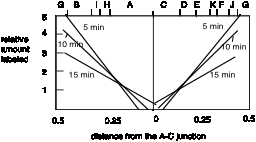
Fig. 6.4.B.
Question 6.2: What would the pattern be for unidirectional replication?
Question 6.3: What would be the pattern if there were two origins, say in fragments E and H, with bidirectional replication from each?
2‑dimensional gels to analyze the number and
position of replication origins
For the most common replicative structure, in which both strands are replicated simultaneously to form replication “eyes”, replication origins can be mapped on the basis of the shapes of origin-containing fragments. If a population of replicating DNA molecules is cleaved by restriction endonucleases, the resulting fragments will have distinctive shapes depending on whether or not they contain a replication origin (Figure 6.5). A restriction fragment encompassing the origin will form a replication bubble, whereas other DNA fragments without origns will have a replication fork moving through them and thus will have a Y-shape.
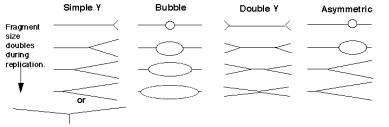
Figure 6.5. Replicating molecules have different shapes generated by replication bubbles and forks. The simple Y results from a single replication fork moving through the DNA fragment, whereas the double Y results from two forks moving in opposite directions through the DNA fragment. Movement of a replication fork from an origin generates a bubble. If the origin is centrally located in the DNA fragment, all or almost all of the replication intermediates will contain a bubble (illustrated in the second panel). Under some circumstances, such as when an origin is close to one end or when fork movement is unidirectional, one fork can reach one end before the other. In this case, early replicate structures have a bubble and later replicated structures have a Y (illustrated in the fourth panel).
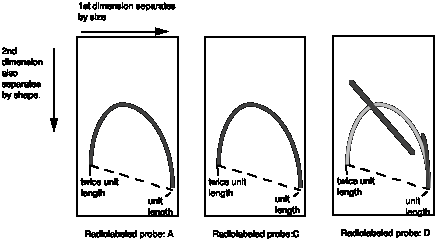
In 1987, Brewer and Fangman introduced the use of two-dimensional agarose gels (2-D gels) to distinguish these shapes and thereby map origins of replication. The key experimental advance was to design electrophoretic conditions that would resolve the nonlinear, replicating DNA molecules from the linear, nonreplicating molecules. This was accomplished by using two-dimensional agarose gels. The first dimension is a conventional separation by size. In the second dimension (run perpendicular to the first) the molecules are separated mainly on the basis of their shape. Nonlinear DNA molecules move anomolously on agarose gels when compared to linear DNA. This anomolous migration is accentuated by increasing the voltage and concentration of agarose, so that deviation from a linear rod‑shape gives a much slower mobility. In practice, the first dimension is run in 0.5% agarose at 1 v/cm, and the second dimenstion is run in 1.0% agarose at 8 v/cm, and with ethidium bromide.
Replicating DNA molecules are isolated (e.g. from rapidly growing cells in culture), cleaved with restriction endonucleases and separated on a two-dimensional agarose gel. In the gel, all the fragments of the chromosome are present, but particular fragments from a digest can be visualized by Southern blot‑hybridization, using the particular fragment as a hybridization probe.
If the hybridization probe is a DNA fragment containing an origin, it will reveal a series of DNA fragments containing bubbles of different sizes. As illustrated in Figure 6.6A, molecules that have just initiated replication are smaller and will move fast in the first dimension. They will also have a small replication bubble, and hence they will move fast in the second dimension. However, those with more extensive replication will have a larger bubble. These molecules are larger, and thus move more slowly in the first dimension, but importantly, the larger bubbles will move even more slowly in the second dimention, since they have the greater deviation from linearity. This generates a characteristic "bubble arc" on the two-dimensional gel. The mobility expected for linear molecules increasing in size from one unit to two is shown as a dashed line in Fig. 6.6, so that the deviations from linearity can be seen more clearly.
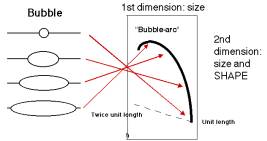
Figure 6.6.A. Bubble arcs on 2-D gels. A DNA fragment containing a replication origin will have one or two replication forks moving through it, generating bubbles of increasing size. When such a fragment is used as a hybridization probe, the population of origin-containing fragments will be detected as bubble arcs on two-dimensional gels.
A DNA fragment without an origin will be copied by a replication fork moving through it. Hence it will generate a series of "Y" shapes on the two-dimensional gels. A Y with a fork in the middle of the fragment gives a very slow mobility in the second dimension, because of its large deviation from linearity. In contrast, a small Y at one end or a Y almost at the end of the fragment moves essentially like a linear rod. Hence the "Y arc" on the two-dimensional gels starts on the diagonal expected for simple linear molecules (unit length), moves through an arc with an apex at 1.5 unit lengths (the slowest mobility in the second dimension) an returns to the diagonal at 2 unit lengths.
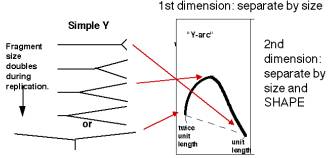
Figure 6.6.B. Y-arcs on two-dimensional gels of replicating molecules.
Similar logic applies to fragments with replication forks coming in from both sides ("double Y arc"), which shows the approximate position of a terminus (Figure 6.6.C, third panel). Also, fragments in which the origin is off‑center (an asymmetric arc, which is a combination between a "bubble arc" and a "Y arc") allow one to map the position of the origin precisely (Figure 6.6.C, fourth panel). It can be calculated from the site where the “bubble arc” shifts to a “Y arc”.
“Double Y” “Asymmetric”
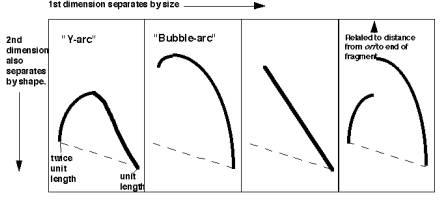
Figure 6.6.C. Summary of the patterns of fragments containing replication intermediates in two-dimensional gels.
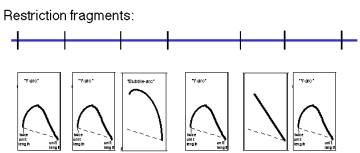
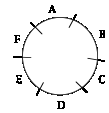
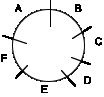
Question 6.4. A restriction map is shown for a portion of a chromosome below, along with the patterns on two-dimensional gels for the replication intermediates formed by each fragment. Where are the origins and termini? Can you deduce the direction of replication fork movement?
Question 6.5. How can you calculate the position of an origin within a DNA fragment from an asymmetric fork/bubble pattern on a 2-D gel of replicating DNA molecules?
Replication landscape in E. coli :Initiation at oriC, elongation and termination at ters
The origin of replication on the circular chromosome of E. coli illustrates to interactions of specific DNA sequences and proteins in the tightly regulated process of initiating replication. Replication in E. coli begins at a specific sequence called oriC. This is the single origin of replication on this chromosome, and DNA synthesis proceeds in both directions from it (Figure 6.7). The sequence oriC was identified by its ability to confer the capacity for autonomous replication on a DNA molecule. In this experiment, the origin of replication of a plasmid containing a drug-resistance marker gene was inactivated by mutation, hence making it impossible to replicate in bacteria. Random fragments of E. coli DNA were ligated into the mutated plasmid, and these recombinants were transformed into E. coli, screening for the ability of the bacterial DNA fragments to provide the ability to replicate, thereby producing a drug-resistant strain. Note that this genetic assay reveals a replicator, i.e. the DNA fragment required in cis for a DNA molecule to replicate. Further biochemical analyses showed that DNA synthesis also initiates within oriC, hence it is also an origin of replication. Although replicators and origins often map close to each other (and may be the same for the some replication units), that is not a requirement. In some replicators, the origin is a broad zone that encompasses a more precisely defined replicator, such as the origin of replication for bacteriophage l.
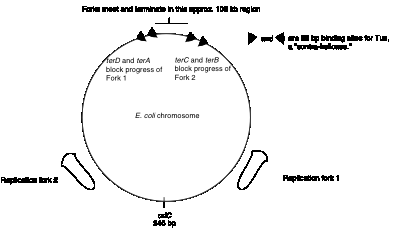
Figure 6.7. Sites for
initiation and termination of replication in E. coli.
A.
1 GGATCCGGAT AAAACATGGT GATTGCCTCG CATAACGCGG
TATGAAAATG GATTGAAGCC
61 CGGGCCGTGG ATTCTACTCA
ACTTTGTCGG CTTGAGAAAG ACCTGGGATC CTGGGTATTA
121 AAAAGAAGAT CTATTTATTT AGAGATCTGT TCTATTGTGA TCTCTTATTA GGATCGCACT
181 GCCCTGTGGA TAACAAGGAT CCGGCTTTTA AGATCAACAA
CCTGGAAAGG ATCATTAACT
241 GTGAATGATC GGTGATCCTG
GACCGTATAA GCTGGGATCA GAATGAGGGG TTATACACAA
301 CTCAAAAACT GAACAACAGT TGTTCTTTGG ATAACTACCG GTTGATCCAA
GCTTCCTGAC
361 AGAGTTATCC ACAGTAGATC GCACGATCTG
TATACTTATT TGAGTAAATT AACCCACGAT
Figure
6.8.A. Sequence features in oriC
of E. coli.
A. Annotated sequence of oriC. The sequence is from GenBank locus ECOORI, accession J01657. The probable left and right ends of oriC are 128 and 377. Binding sites for DnaA (from GenBank annotation) are doubly underlined, and the 9 bp repeat within them is red. The consensus for the 9 bp repeat is TTATMCAMA (M=C or A) or its reverse complement TKTGKATAA (K=G or T). A minor DnaA binding site is underlined with a dotted line. The BglII cleavage sites are underlined. They are contained within two of the three 13 bp repeats, which are colored blue. GATC motifs are underlined with a wavy line; note that the BglII cleavage sites contain GATC.
B.
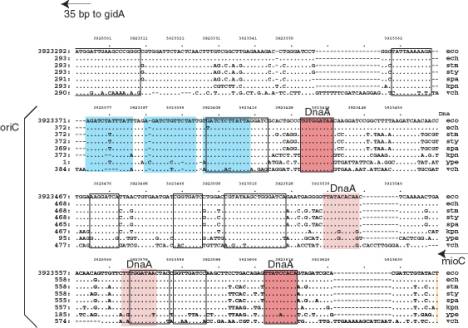
Figure
6.8.A. Sequence features in oriC
of E. coli.
B. Aligned sequences of oriC from E. coli and homologs from several enteric bacteria. The alignment is from the Menteric server at http://bio.cse.psu.edu. The 13 bp repeats are colored blue. Conserved sequences identified at the default parameters of the Menteric server are boxed with a black outline. Two of these are binding sites for DnaA, and these are colored red. Two other DnaA binding sites are slightly less conserved; these have a lighter shade of red and no black outline. Note that the functional DnaA binding sites are conserved in this range of bacteria. Also, some highly conserved sequences have not yet been identified as a specific binding site for a protein; these would be interesting for further study.
The minimal fragment of E. coli DNA active in the above assay is referred to as oriC, for the origin of the E. coli chromosome. It is approximately 245 bp long, and contains 3 copies of a 13-mer repeat, 4 copies of a 9-mer repeat, and 11 GATC motifs (Fig. 6.8A). These features, and others, are highly conserved in the enteric bacteria such as E. coli and its relatives such as the Salmonella species, Klebsiella andVibrio cholera. (Fig. 6.8B).
The DnaA protein binds specifically to the 9-mer repeats (Fig. 6.9). Temperature-sensitive mutations in the dnaA gene cause a slow-stop phenotype at the restrictive temperature, showing that the primary role for the DnaA protein is in initiation. It is the only protein known to be used only in initiation of replication, not other stages. Once the 4 copies of the 9-mer sequence are occupied by DnaA protein, many more molecules of DnaA bind cooperatively to those on the DNA, eventually leading to binding of 20-40 protein monomers in a large core. This large protein-DNA complex causes the DNA to melt at the three 13-mer repeats.
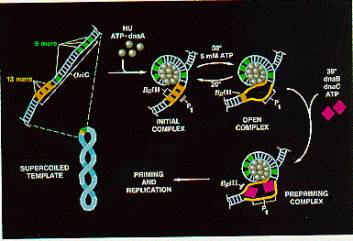
Figure 6.9. Initiation at oriC. Adapted from Kornberg and Baker, DNA replication, 2nd edition, Freeman Inc.
Question 6.6. The
diagram for Fig. 6.9 contains information that can be used to design two assays
for melting of DNA at the origin. Nuclease P1 cleaves single stranded DNA,
whereas the restriction endonuclease BglII cuts only duplex DNA. After DnaA has bound to DNA at oriC in the presence of ATP, how can you distinguish
between the initial complex and the open complex?
The DnaB hexamer can now bind to the melted DNA at the origin. This is the same DnaB that we encountered in the primosome, and like those reactions, it is brought to DNA in a complex with 6 monomers of the DnaC protein. After the DnaB helicase is loaded on the melted DNA, it can carry out its DNA unwinding activity, using the energy of ATP hydrolysis to break apart base pairs in the DNA. Action of DnaB melts the DNA beyond the 13-mer repeats and displaces the DnaA protein complex. In the absence of polymerase, a long segment of DNA can be unwound (about 1000 bp) but in the presence of replicating polymerases, the region unwound is only about 60 bp.
This unwinding of about 60 bp allows other proteins to bind to establish the two replication forks at this bidirectional origin. SSB coats the single strands formed by melting and unwinding. DnaB and the single stranded DNA activate the Dna G primase to form the primers for the replication forks. DNA polymerase III holoenzyme can bind a begin replcation from the primers. Movement of the replication forks proceeds as described in the previous chapter. Gyrase acts as a swivel, allowing one strand to rotate around the other.
Question 6.7. (a) Assume that gyrase activity maintains a constant superhelical density while DNA is being replicated. How often will it have to act? (b) If one cycle of gyrase action requires the hydrolysis of one ATP molecule, how many ATP molecules are consumed by the unwinding and writhing for that one cycle of gyrase action?
The two replication forks launched from oriC proceed in opposite directions around the circular chromosome, synthesizing DNA at a rate of approximately 50,000 bp per min. Note that this means the DNA is untwisting at about 5,000 revolutions per min ahead of each fork. Not only are the helicases working efficiently and consuming large amounts of ATP, but gyrase is highly active, providing a critical swivel point for the replication machinery, allowing the rapid rotation required for the unwinding.
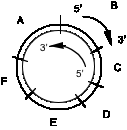
The two replication forks effectively divide the E. coli chromosome into two replicores, each containing about half the chromosome (Fig. 6.10). The replicore is the chromosomal DNA synthesized by a particular replication fork. Replicore 1 is synthesized by the replication fork moving in a clockwise direction on the conventional genetic map of E. coli. For this replicore, the leading strand is the one running 5’ to 3’ in the same direction as the genetic map (increasing from 0 to 100 min). Replicore 2 is synthesized by the replication fork moving in a counterclockwise direction, and of course the opposite strand will be the leading strand. For both replicores, the leading strand has more G than C. Also, the trinucleotide CTG occurs more frequently on the leading than lagging strand. The leading strand is the template for lagging strand synthesis, and a CTG on the leading strand serves as a primase binding site and a primer initiation site. Hence the oligonucleotide bias on leading versus lagging strand fits with the needs for multiple priming events during discontinuous replication. The recombination hot-spot Chi is more frequent along the leading strands. Finally, most genes are transcribed in the same direction as the replication fork moves in these replicores. The full significance of some of these observations is still not clear, but they point to an overall organization of the genome with respect to replication. It will be of considerable interest to see whether these patterns are found in replicores in other organisms.
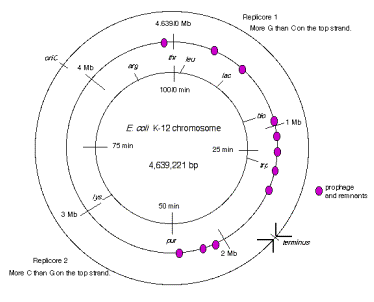
Figure 6.10. Replicores on the E. coli chromosome. The term “top” strand refers to DNA strand running 5’ to 3’ in the same direction as the genetic map (increasing from 0 to 100 min. This is the same strand as is listed in the standard E. coli K12 sequence in the databases.
The two replication forks meet on the side of the chromosome opposite oriC. Termination occurs in a zone where the forks meet (Fig. 6.7). It is restricted to this zone by the action of the Tus protein at ter sequences. The ter sequences block further progression of the replication fork, with a clear polarity.The sequences terD and terA block the progress of the counter‑clockwise fork (Fork 1 in Fig. 6.7) but allow clockwise replication (Fork 2) to proceed through. In contrast, terC and terB block the progress of the clockwise fork (Fork 2 in Fig. 6.7) but allow counter‑clockwise replication (Fork 1) to proceed through. The ter sequences are 23 bp and are binding sites for the Tus protein, the product of the tus gene ("ter utilization substance"), which is required for termination. It prevents further helicase action from the replication fork.
Resolution of the replicated chromosomes occurs when the two replication forks meet. Since these are moving in opposite directions, the distribution of ter sites roughly opposite to the ori insures that the two replication forks will meet in the zone between the oppositely oriented ter sites.
One scenario is illustrated in Fig. 6.11. Let Fork 1, moving in a counter-clockwise direction, proceed as far as it can, i.e. to the terD, terA sites. Fork 2, moving in a clockwise direction, can proceed past these ter sites, and will it will meet Fork 1. The two sets of products from each replication fork are then joined. The leading strand synthesized from Fork 2 joins the lagging strand synthesized from Fork 1. Likewise, the lagging strand from Fork 2 joins the leading strand from Fork 1.
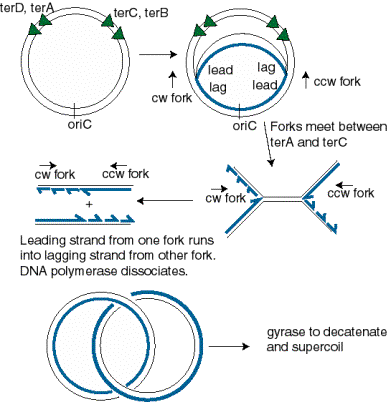
Figure 6.11. Resolution of replication forks in the termination zone. The abbreviations are cw=clockwise and ccw=counter-clockwise, lead=leading strand, lag=lagging strand.
Question 6.8. Use the model for lagging strand synthesis to explain how the leading strand is joined to the lagging strand when the replication forks meet and resolve.
Control of initiation at oriC by methylation
A new round of replication will initiate on the E. coli chromosome at oriC only when the growth conditions permit it. The dam methylase and features of its sites of action are used to prevent premature re-initiation.
The dam methylase of E. coli recognizes the tetranucleotide GATC in DNA and transfers a methyl group (from S‑adenosyl methionine) to the amino group at position 6 of the adenine in that sequence. Note that GATC is a pseudopalindrome, so both strands read the same for these four nucletides in DNA. Thus a GATC in duplex DNA can be unmethylated on either strand, methylated on only one strand (referred to as hemimethylated) or methylated on both strands (referred to as fully methylated), as shown in Fig. 6.12.
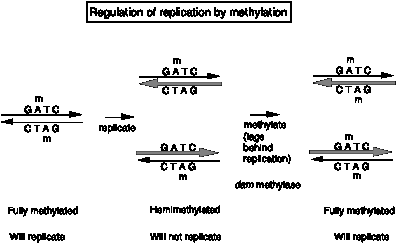
Fig. 6.12.
The methylation status of the 11 GATC motifs at oriC regulate whether replication can intitiate. When the GATCs are fully methylated, oriC DNA serves as an origin (in the presence of Dna A and the other proteins discussed above). However, when the GATCs are hemimethylated, it is not active as an origin. The reason for thnis is not fully known. One hint comes from the behavior of unmethylated oriC (from dam- strains). This unmethylated oriC is active, showing that methylation of the GATC is not a requirment for initiation, and further suggesting that some inhibitor of initiation recognizes the hemimethylated form.
Question 6.9. How do these results lead to this conclusion? Let’s explore this by posing the opposite hypotheses. (a) If methylation of the GATC motifs at oriC were needed for initiation, what would the result have been? (b) If some activator recognized the fully methylated form, what would the result have been.?
Re-methylation of oriC by the dam methylase is quite slow. Thus for some period the GATCs at oriC are hemimethylated, and the origin is inactive. This provides a means to delay the use of oriC to start another round of replication. Thus the methylation of the GATCs is part of a mechanism to regulate the timing of firing of oriC. In the next chapter, we will also see the use of methylation of GATCs in post-replicative repair.
Origins of replication in yeast: Autonomously replicating sequences
Eukaryotic organisms usually have to synthesize much more genomic DNA than is found in bacteria, and the template for replication is chromatin, not just DNA. Also, and perhaps related to the effects of this protein-DNA template, replication fork movement is considerably slower in eukaryotes, being only about 1,000 to 3,000 bp per min, compared to the very rapid rate of 50,000 bp per min in bacteria. Consequently, eukaryotic organisms take more time to replicate their genomes, and they use many origins per chromosome.
Much is now known about the genetics and some biochemistry of replication in the budding yeast Saccharomyces cerevisiae, whereas in plants and animals, more detailed biochemical information is derived largely from viral systems. In this section, we will examine some aspects of the replication origins in yeast and proteins that act at those origins.
1 GAATTCTAGG TGATATTGCA ATTACTTCTT CTCATGCACT AACAAGTGAA
51 TGATAGAAAT ATGTTGAGTT GCTAACTGCC TGATTTTAAA TAAGTTTCAT
101 ATTATAATCT TTTAGCATAT
ATATATATAT ATTGATCCTC TCTCTTCTTT
ARS core consensus
151 ATTTCGCCAG TAACCCAGTG
TGTGAAGAAG AAAACATAAA TAAAAAAGCA
201 GTAGCACATG GACACATTCA
CGCCCGAACA CTTCTAAAAA GCAGCCCACA
251 CAAGAAAGTA GATATAATGT
AGGACACCCA GCTTGTCCAT AATTGCTAAT
301 AGCATACTCA GGATAACATA
TATTAATGAC GACTCGTTTG CTCCAACTCA
ARS core consensus
351 CTCGTCCTCA TTACAGATTA
TTATCCCTAC CTCTCCAGAA ACCCTTCAAT
401 ATAAAAAGGG CAGATGTCCG
CTGCGAACCC TTCTCCATTT GGCAATTATT
451 TGAACACCAT CACTAAGTCC
CTACAACAGA ATTTACAAAC ATGCTTTCAT
501 TTCCAAGCAA AAGAAATCGA T
Figure 6.12 DNA sequence of ARS1 from S. cerevisiae. Matches to the core consensus sequences of ARSs are underlined doubly for an exact match and singly if the segment has a single mismatch from the consensus. Two matches to the consensus overlaps for 5 bp from positions 187 through 191.
Replication in S. cerevisiae starts from 250-400 replication origins distributed among its 16 chromosomes. Many, if not all, of these origins are also autonomously replicating sequences, or ARSs. ARSs were isolated in a similar approach to that used for isolating the bacterial oriC. Yeast plasmids carrying a selectable marker were mutationally inactivated in their plasmid origins, genomic yeast DNA fragments were ligated into the mutated plasmids, and transformed yeast were screened for the selectable marker, which should only be present in strains carrying a replicating plasmid, i.e. one with a functional origin of replication provided by the added yeast genomic DNA fragment. These ARSs have the genetic properties of replicators. Many have been isolated and mapped, and of course their positions along the chromosome are known because of the complete genomic DNA sequence. Some of these ARSs have now been shown to function biochemically as origins of replication. Mutliple ARSs/origins are found along each yeast chromosome.
The DNA sequence of each ARS is distinctive, but many share properties in common. Alignment of many ARSs reveals an A+T-rich core consensus sequence, WAAAYATAAAW (W=A or T, Y=C or T). One exact and one partial match to this consensus are shown in Fig. 6.12 for ARS1. The core sequences a and b comprises an ARS consensus sequence that is essential for origin function, but it is not sufficient. Additional sequences surrounding the consensus are also needed.
The core consensus sequences are binding sites for proteins involved in replication. The major protein is the origin recognition complex, or ORC. This is a complex composed of six subunits, named ORC1-ORC6 (numbered from largest to smallest molecular weight). The complex binds to origins of replication in an ATP-dependent manner and directs DNA replication to start at the origin. ORC was initially isolated on the basis of its ability to bind to ARSs, and subsequent studies have shown that it is required for replication and cell viability. Null mutations in any of the six genes encoding ORC (ORC1-ORC6) are inviable, but temperature sensitive loss-of-function alleles are available for the ORC genes. The critical role of the ORC is not restricted to budding yeast. Homologs to the largest subunit, ORC1, have been identified in other fungi, in Drosophila, in amphibians and in humans. ORC also plays a key role in chromatin silencing at HML and HMR, the silent storage sites used in mating type switching.
Like its bacterial counterpart, DnaA, the ORC carries out 3 functions at the origin. It binds to the specific DNA sequences in the origin, it induces local unwinding of the DNA at the origin, and it recruits other replication enzymes. At least in yeast, the ORC binds stably to the origin (even after it has fired), and it is thought that the recruitment of additional proteins, such as Cdc6p and the Mcm proteins (see below), is a critical point of control on replication.
Once DNA synthesis has initiated at the origin, new replication forks move bidirectionally (in most cases) away from the origin, and terminate when they meet opposing replication forks from adjacent replicons. In this manner, almost all of a linear chromosome is replicated by the many replciation forks that start at multiple origins. However, a problem arises at the ends of the chromsomes, as will be explored in the next section.
The
problem of linear templates
The requirement of DNA polymerases to have a primer causes a problem at the ends of linear templates. As illustrated in Fig. 6.13, leading strand synthesis can proceed to the end of its template strand, but lagging strand synthesis cannot. As lagging strand synthesis nears the end of its template, at some point no binding site will be available for primase, and part of the 3’ end of the template for lagging strand synthesis will not be copied. Hence a 3’ overhang is left after the replication fork has finished, and part of the chromosome is not copied into new DNA. If nothing else were done, the chromosome would become progressively shorter after each round of replication.
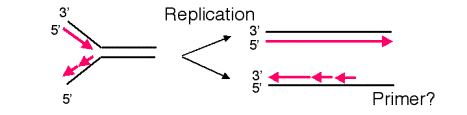
Figure 6.13. Lagging strand synthesis cannot copy the end of a linear chromosome.
At least three different types of solution to this problem have been discovered in various organisms. One, utilized by bacteriophage such as l and T4, is to convert the linear template to a circle. For instance, the linear chromosome of bacteriophage l has cohesive ends (complementary single strands at each end, generated by a phage endonuclease) that can anneal upon infection, thereby forming a cirucular template for replication. Other viruses, such as adenovirus, attach a protein to the end of unreplicated DNA to serve as a primer. Such an attached protein obviates the requirement for using the unreplicated DNA as a template, and the entire viral chromosome can be replicated.
A third solution is to make the
ends a series of simple repeats that are synthesized in a process distinct from
DNA replication. Indeed, the ends of the linear chromosomes of most (perhaps
all) eukaryotes, called telomeres, are
composed of many copies of a simple repetitive sequence. This sequence is
distinctive for different organisms, but in all cases one strand is rich in G
and the other is rich in C. The repeating unit for human telomeres is 5' AGGGTT
3' running from the centromeric end of the repeats to the telomeric end), and
the repeating units for the ciliate Tetrahymena is 5' GGGGTT 3’.
New copies of the telomeric repeats can be synthesized each time the chromosome replicates (Fig. 6.14). This re-synthesis of the telomeric repeats counteracts the progressive shortening of the linear chromosomes that would occur if only the replication forks were used to synthesize new chromosomes.

Figure 6.14. Addition of new telomeric repeats to the ends of replicated chromosomes.
In this figure, the string of "a" at the ends of the chromosome is the tandem repeat of simple sequence, in duplex form. For instance, for a human chromosome, "a" would be
CEN ... 5' AGGGTT 3' ... TEL
3' TCCCAA 5'
or for a Tetrahymena chromosome, "a" would be
CEN ... 5' GGGGTT 3' ... TEL
3' CCCCAA 5'
In each case, the "a" or monomer is repeated thousands of times in tandem.
Addition of new telomeric repeats is catalyzed by the enzyme telomerase. As illustrated in Fig.6.15, this enzyme catalyzes many successive rounds of synthesis, adding many copies of the simple repeat to the ends of the chromosomes. The enzyme is a ribonucleoprotein, i.e. it has both a polypeptide and an RNA component. The RNA serves as a template to direct addition of nucleotides to the 3' end of the G+T rich strand, and the polypeptide acts as a reverse transcriptase to make a DNA copy of a hexanuclotide segment of the RNA. For instance, the telomerase from Tetrahymena will copy the 3’CCCCAA in the RNA template into 5’GGGGTT telomeric repeat. Then the enzyme shifts over and synthesizes another hexanucleotide. The fact that the RNA serves as the template was demonstrated by exchanging the RNA component of isolated telomerase with the telomerase RNA from a second species. This exchnage led to the addition of telomeres with sequences characteristic of that of the second species, showing that the telomerase RNA is the determinant of the sequence of the telomere. The protein component provides the reverse transcriptase activity.
Once many copies of the G+T-rich strand of telomeres have been synthesized by telomerase, the long single strand forms a specialized structure toward the 3’ end. Some evidence indicates that a “G-quartet” is formed, in which four guanine nucleotides form a hydrogen-bonded complex. Examination of the ends of replicating chromosomes in the electron microscope show a circular structure. Although details of the structure at the end of this strand are not fully established, it is likely that a primer to support synthesis of the C+A-rich strand is made effectively by turning the G+T-rich strand around. Conventional synthesis by DNA polymerases can then copy the G+T-rich strand to make the complementary strand. Some processing, e.g. nucleases acting at the end, can convert the specialized structure or hairpin into a linear duplex.
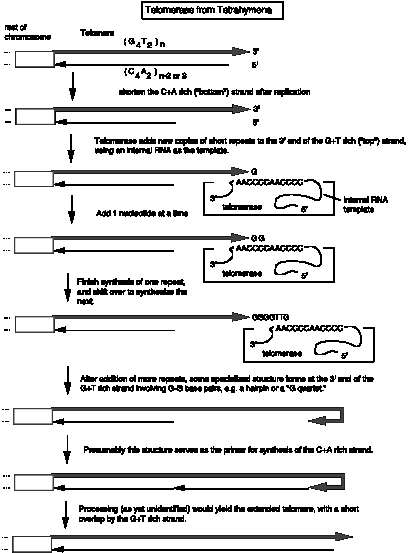
Figure 6.15.
Synthesis of new telomeric repeats catalyzed by telomerase. This enzyme is a ribonucleoprotein complex. The RNA
component is the template for synthesis of telomeric repeats.
Question 6.10. How processive is telomerase?
Not all replicating cells have telomerase activity. This activity is higher in some transformed cells than in nontransformed cells. Also, older cells tend to have shorter telomeres. Thus telomeres are being actively investigated as possibly playing roles in both aging and in tumorigenic transformation.
Telomeres are important for stabilizing chromsomes. Some chromosomal deletions remove the ends of the chromosome, including the telomere, and these shortened chromosomes are less stable than their wild-type counterparts. Directed mutations have been made in mice to eliminate telomerase activity. These mice are viable for several generations, but they show many broken and abnormal chromosomes, demonstrating the importance of this activity.
Cellular control of replication in bacteria
We have seen that the initiator protein DnaA and the replicator element oriC are needed for the initiation of replication, and that the slow rate of methylation at GATC motifs prevents re-initiation for some time. The bacterial cell can sense when the nutritional conditions, levels of nucleotide pools, and protein concentrations are adequate to support a round of replication. The details of this monitoring are beyond the scope of this presentation, and can be explored in references such as Niedhart et al. In general, initiation is triggered by the increase in cell mass. Initiation occurs at a constant ratio of cell mass to the number of origins. This suggests that a mechanism exists to titrate out some regulatory molecule as the cell mass increases, but the molecule and mechanism have not been elucidated.
The result of this monitoring and signalling is the formation of an active DnaA complex at oriC, followed by unwinding the DNA and the other events discussed above.
Depending on the growth conditions, bacteria can divide rapidly or slowly. In rich media, the cell number can double every 18 min, whereas when nutrients are scare, the doubling time can be long as 180 min. The bacterial cells accomplish this by varying the rate of re-initiation of replication. Re-initiation has to occur at the same frequency as the cell doubling time.
Although the frequency of re-initiation can be varied 10-fold, the time required for the replication cycle is constant. This cycle consists of two periods called C and D. The elongation time, or C period, is the time required to replicate the bacterial chromosome. From initiation to termination, this is about 40 min. The division time, or D period, is the time that elapses between completion of a round of DNA replication and completion of cell division. This is about 20 min. Hence the time for the replication cycle (C period plus D period) is essentially constant in bacterial cultures with doubling times shorter than 60 min.
In order to accommodate the variation in cell doubling time within the constraints of the constant time for replication (C+D), rapidly growing bacteria have chromosomes with multiple replication forks. The constant replication cycle time means that a round of replication must be initiated 60 min (i.e. C+D) before cell division. However, re-initiation can occur before 60 min has past. This is illustrated in Fig. 6.16 for cells in a culture dividing every 30 min. When the cell doubling time is less than 60 min, a cycle of replication must initiate before the end of the preceding cycle. This results in chromosomes with more than one replication fork.
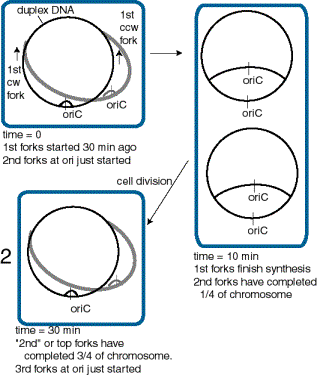
Figure 6.16. Multiple replication forks per chromosome allow bacteria to divide more rapidly than the replication cycle time. This diagram illustrates a bacterial cell dividing every 30 min, and hence initiating a new cycle of replication every 30 min.
Question 6.11. If the time required for two replication forks traveling in opposite directions to traverse the entire E. coli chromosome at 37oC is about 40 min, regardless of the culture conditions and the time required for cell division (D period) is 20 min, how many replication forks will be present on each DNA molecule in the culture?
Cellular control of replication in eukaryotes
Actively growing (or dividing) eukaryotic cells pass through a cell cycle that is divided into four phases (Fig. 6.17). Classic studies showed that cells in two of these phases are discernable in the light microscope. Cells undergoing mitosis have condensed chromosomes, and in most organisms (but not yeast), the nuclear membrane breaks down. Cells with this appearance are in M phase (for mitosis). The other observable phase is S phase (for DNA synthesis). Cells in S phase can be marked by the incorporation of labeled thymidine into the nuclear DNA. These two phases are separated by two "gaps", G1 and G2. G1 is a time of preparation for DNA synthesis in S phase, building up dNTPs and other components needed for replication. G2 follows completion of DNA replication and precedes the initiation of mitosis. Nonreplicating, or quiescent cells, can be considered to be "out of the cycle" or in a state referred to as G0. One can now separate cells by DNA content in a flow cytometer, allowing one to distinguish cells in G1, with a 2n chromosomal content, from those in G2 and early M, which have a 4n chromosomal content. Cells at progressive times during S phase have increasing DNA content.

Figure 6.17. The eukaryotic cell cycle
Passage from one phase to the next is a highly regulated event. Critical control points, or checkpoints, are found at the G1 to S transition and at the G2 to M transition. The checkpoint in late G1 is the time for the cell to assess whether it has enough nucleotides, proteins and other materials to make two cells. The checkpoint prior to the G2/M transition allows any necessary repairs or corrections in the DNA to be made prior to mitosis. Loss of control of the G0 to G1 transition, or at the other checkpoints, generates cells that grow in an uncontrolled manner. This inappropriate expansion in the number of cells is fundamental to the progression of cancers, and hence the study of the molecular events at these checkpoints is an intensely active area of research in cell biology and biochemistry. A full treatment of this important topic is beyond the scope of this course. In general, cell cycle progression is regulated by environmental signals (such as extracellular growth factors) and intracellular monitors of metabolic state, intactness of DNA, and so forth. These disparate signals eventually impinge on highly regulated protein kinases. Activation of particular protein kinases is required for progression through each checkpoint. In general, two types of regulation have been seen.
(1) Control of the amount of key proteins. The concentration of proteins called cyclins rise and fall through the cell cycle. Some of the cyclins are components of protein kinases whose activity regulates passage through the checkpoints. The cyclins must be present at a sufficiently high concentration for the kinase to be active.
(2) Control of the state of phosphorylation. Proteins regulating the cell cycle (as is true of many regulatory proteins) can be covalently modified, e.g. by phosphorylation in a process catalyzed by protein kinases. The state of phosphorylation will determine the level of activity of the protein. So for instance a key protein kinase regulating passage through the G1 to S checkpoint must have its catalytic subunit in the correct state of phosphorylation, as well as having sufficient amounts of its cyclin subunit.
Many lines of investigation are being pursued to understand better the regulation of the cell cycle. One fundamental approach has been be isolation of scores of conditional yeast mutants that are defective in their progression through the cell cycle at the restrictive temperature. These mutants have particular phenotypes depending on which stage of the cell cycle they arrest in under nonpermissive conditions. The complementation groups defined by such mutants are called CDC, for cell division cycle phenotypes, followed by a number. For example, a protein kinase whose activity is needed for both the G1/S and the G2/M transition in S. cerevisiae is the product of the CDC28 gene, and the polypeptide is called Cdc28p.
Once a cell has entered S phase, each origin of replication must fire once, but only once. As discussed above, the ORC is required for initiation of replication at an origin, but what determines when the origin fires? This is a matter of considerable current study, and many of the details are still unknown. In S. cerevisiae, the ORC binds to specific DNA sequences, the origins of replication, throughout the cell cycle, not just during S phase when the origins are active. During G1 phase, ORC recruits other proteins, such as Cdc6 and Mcm (minichromosome maintenace) proteins, to form a prereplication complex. At the G1/S transition, additional factors associate with this complex, and a cyclin-dependent kinase (CDK) activity stimulates intitiation of replication in S phase. After initiation, the Cdc6 and Mcm proteins are released from the prereplication complex, leaving the ORC still bound to the origin but unable to reinitiate replication until the next cell cycle. In mammals, an intact ORC is not stably bound to the origin, but rather one of the subunit, ORC1, is recruited to the origin at a defined time during G1. However, in both yeast and mammals, events in G1 involving the preinitiation complex mark an origin for firing in the next S phase.
As discussed above, many origins of replication, and hence many replicons, are used to replicate each chromosome. These origins do not all fire at the same time. In fact, replicons can initiate at different times during S phase. Replicons containing genes that are actively expressed in a given cells tend to replicate earlier in S phase than do replicons containing nonexpressed genes. This is an example of tissue-specific variation in replication timing. The time during S phase at which a particular origin will fire is determined early in G1, at the time that chromatin domains are repositioned in the nucleus following mitosis and before the preinitiation complex forms. Events important to the regulation of initiation at replication origins occur at various times during G1, but the full range of proteins and activities carrying out these events is still a matter of study.
References:
Jacob, F., Brenner, S. and Cuzin, F. (1963) On the regulation of DNA replication in bacteria. Cold Spring Harbor Symposium on Quantitative Biology 28: 329-348.
Danna and Nathans, D. (1972) (Proc. Natl. Acad. Sci., USA 69: 3097-3100.
Brewer and Fangman (1987) Cell 51: 463-471.
Dutta A and Bell SP (1997) Initiation of DNA replication in eukaryotic cells. Annu Rev Cell Dev Biol 13():293-332
Cimbora, Daniel M. and Groudine, Mark (2001) The control of mammalian DNA replication: A brief history of space and timing. Cell 104: 643-646.
Diffley, John F.X. (1995) Once and only once upon a time: specifying and regulating origins of DNA replication in eukaryotic cells. Genes & Development 10:2819-2830.
DNA REPLICATION
II, Chapter 6
QUESTIONS
Question 6.12 At what step is the rate of DNA replication in E. coli is regulated - initiation, elongation or termination?
Question 6.13 The following problem further illustrates the analysis of replication by pulse-labeling, using a hypothetical virus and constructed data. Consider the replication of a circular viral DNA in infected cells. The infected cells were pulse labeled with [3H] thymidine for 1, 2, 3 and 4 min; it takes 4 min for the DNA molecules to be replicated in this system (from initiation to termination). Those DNA molecules that had completed synthesis at each time point were isolated, cut with a restriction endonuclease, and assayed for radioactivity in each fragment. This restriction endonuclease cleaves the circular DNA into 6 fragments, named A, B, C, D, E, and F in a clockwise orientation around the genome. The following results were obtained; a plus (+) means the fragment was radioactively labeled, and a minus (-) means it was not labeled.
|
Fragment |
Time of labeling (min) |
|||
|
|
1 |
2 |
3 |
4 |
|
A |
- |
- |
+ |
+ |
|
B |
- |
- |
- |
+ |
|
C |
- |
- |
+ |
+ |
|
D |
- |
+ |
+ |
+ |
|
E |
+ |
+ |
+ |
+ |
|
F |
- |
+ |
+ |
+ |
a) What restriction fragment has the origin and which has the terminus of replication?
b) In which direction(s) does this viral DNA replicate?
Question 6.14 The two-dimensional gels developed by Brewer and Fangman were used to examine the origin of replication of a DNA molecule. In this system, replicating molecules are cleaved with a restriction endonuclease and separated in two dimensions. The first dimension separates on the basis of size, and the second separates on the basis of shape (more pronounced deviations from linearity move slower in the second dimension). After blotting the DNA onto a membrane, it is probed with fragments from the replicon under study. Restriction fragment P gives the pattern shown on the left, and the adjacent fragment Q gives the pattern shown on the right. The dotted line denotes the diagonal expected if all molecules were linear. Assuming both P and Q are in the same replicon, what can you conclude about the positions of origins of replication?

Question 6.15 Dr. Howard Cedar and his colleagues at the Hebrew University in Jerusalem have developed a replication direction assay to map origins of replication on chromosomes (Kitsberg et al., Nature 366: 588-590, 1993). Growing cells are treated with the drug emetine to inhibit lagging strand synthesis. Leading strand synthesis continues, and this newly synthesized DNA is density labeled by incorporating 5-bromodeoxyuridylate (5-bromodeoxyuridine is added to the medium). The DNA is then sheared and denatured, and the newly synthesized leading strand DNA is separated from the rest of the DNA by sedimentation equilibrium on Cs2SO4 gradients. Samples of the heavy density DNA (containing 5-bromodeoxyuridylate) are spotted onto a membrane, and equal amounts are hybridized to labeled, separated strands of restriction fragments throughout a region.
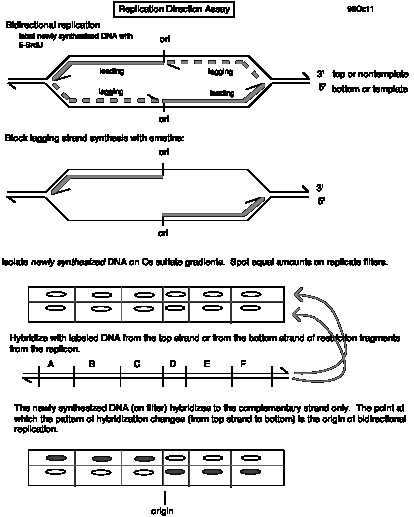
Use of this approach to map replication origins in the human b-like globin gene cluster led to results like those below. The names of the genes are given above the line, and the names of the restriction fragments are given below the line. A + means that the leading strand (with 5-bromodeoxyuridylate incorporated) hybridized preferentially to a labeled probe corresponding to the designated strand, whereas a - means that the leading strand DNA did not hybridize to the designated probe. The genes are transcribed from left to right in this diagram, so the "top" strand reads the same as the mRNA in the coding regions (our convention is "nontemplate") and the "bottom" strand (abbreviated "bot") is complementary to the top strand ("template” or "antisense" strand).
e Gg Ag yh d b
|_|_-->_|____|_-->_|_-->_|____|__-->_|___|_-->_|___|__|_-->_|____|
A B
C D E F G H I J
K L M
+ +
+ + + + + + + +
+ - - top
- -
- - - - - - - -
- + + bot
a. Which restriction fragment(s) contain(s) the origin of replication?
b. Is replication from this origin uni- or bi-directional?
c. Explain how the data led you to your answers to a and b.
d. What direction is the replication fork moving for fragments A through K?
e. What direction is the replication fork moving for fragments L and M?
f. Name a possible target enzyme that could specifically block lagging strand synthesis when inhibited.
e. What cloning vector would be useful for generating the separated strands of the restriction fragments?
Question 6.16 Let's imagine that you have isolated a new virus with a double-stranded, circular DNA that is 6000 bp long. The restriction endonuclease HhaI cleaves the DNA as shown below to generate 6 fragments.
You initially use a pulse-labeling procedure to map the origin and terminus of replication. Infected cells were first allowed to incorporate [32P] phosphate into the DNA for several hours to uniformly label the DNA, and then [3H] thymidine was added for short periods of time (pulse labels), i.e. 5, 10 and 15 min. Completed viral DNA molecules were isolated, cut with HhaI, and separated on polyacrylamide gels. The amount of [32P] and [3H] in each fragment was determined for each period of pulse label and is tabulated below. The data are corrected for thymidine content and normalized so that fragment A has a ratio of 1.
Relative amount of pulse label
|
Fragment |
5 min |
10 min |
15 min |
|
A |
1.0 |
1.0 |
1.0 |
|
B |
0.5 |
0.7 |
1.0 |
|
C |
0 |
0.5 |
0.8 |
|
D |
5.0 |
4.1 |
2.3 |
|
E |
4.2 |
3.2 |
1.7 |
|
F |
2.9 |
2.1 |
1.4 |
(a) Which HhaI fragment(s) contain(s) the origin and terminus of replication?
(b) What is the mode (uni- or bi-directional, or other) and direction(s) of replication (i.e. clockwise and/or counterclockwise)?
(c) To confirm this result and map the origin and terminus more precisely, you analyzed the replicative intermediates on 2-dimensional gels. The DNA from infected cells, containing viral DNAs at all stages of synthesis, was digested with HhaI and then run initially on a gel that separates on the basis of size and then in a perpendicular direction in a gel that accentuates separations based on shape (Brewer and Fangman gels). The DNA in the gel was blotted onto a nylon membrane and hybridized with radiolabeled probes for the viral DNA fragments. The hybridization patterns obtained for HhaI fragments A, C and D are shown. The hypothetical line for linear intermediates of a fragment expanding from unit length to twice unit length is provided as a guide. How do you interpret these data, and what do you learn about the origin and terminus? Please indicate the significance of any transitions in the patterns.
(d) You also used a replication direction assay to examine the replication origin. Virally infected cells were treated with the drug emetine to inhibit lagging strand synthesis. Leading strand synthesis continued during the drug treatment, and this newly synthesized DNA was density labeled by incorporating 5-bromodeoxyuridylate (5-bromodeoxyuridine is added to the medium). The DNA was sheared and denatured, and the newly synthesized leading strand DNA was separated from the rest of the DNA by sedimentation equilibrium on Cs2SO4 gradients. Samples of the heavy density DNA (containing 5-bromodeoxyuridylate) were spotted onto a membrane, and equal amounts are hybridized to labeled, separated strands of restriction fragments throughout the virus. To keep track of strands and orientation in this problem, lets imagine the duplex circle to have an outer strand oriented 5' to 3' in a clockwise direction and an inner strand oriented 5' to 3' in a counterclockwise direction, as diagrammed below.
A grid of samples of heavy density DNA (containing 5-bromodeoxyuridylate, and enriched for leading strand DNA) immobilized on the filter is shown below, with each rectangle representing an equal loading of the heavy density DNA. What will be the pattern of hybridization to the indicated strands of each of the restriction fragments?

What does this experiment tell you about the origin and terminus of replication?
Question 6.17 Are the following statements about the function of the DnaA protein true or false?
a) DnaA protein binds to 9-mer (nonamer) repeats at the origin for chromosomal replication.
b) DnaA protein catalyzes the formation of the primers for leading strand synthesis at the origin.
c) About 20 to 40 monomers of the DnaA protein form a large complex at the origin.
d) DnaA protein melts DNA at a series of 13-mer repeats at the origin.
Question 6.18 Consider a bacterium with a circular chromosome with one replication origin. It takes 30 min for bi-directional replication to copy its chromosome (the elongation time or C period) and 10 min from the end of DNA synthesis until the cell divides (the D period). How many replication forks are needed per chromosome to allow a culture of this bacterium to double in cell number every 20 min? Follow the molecules through a complete cell division cycle.
Question 6.19 In many eukaryotes, actively transcribed genes are replicated early in S phase and inactive genes are replicated late. One assay to determine replication timing is in situ hybridization of cells with a gene-specific, fluorescent probe, followed by examination of the number of signals per nucleus. In diploid cells, an unreplicated gene will be seen as 2 fluorescent dots per nucleus, whereas a replicated gene will be seen as 4 dots. They look like 2 doublets, indicating that the replicated chromatids are close in the nucleus.
The types of pattern one can see at various stages of the cell cycle are shown below. Each dark dot is a fluorescent signal, the larger circle is the cell, and the smaller circle is the nucleus.

The fraction of cells in an asynchronous population with 2 dots or 4 dots is then tabulated. In an asynchronous population, the number of cells in each phase of the cell cycle is directly proportional to the length of that phase. If GENEA were replicated 1 hr after entry into S phase, and GENEB were replicated 1 hr before the end of S phase, what fraction of cells would show 4 dots (two doublets) for each? The length of each phase of the cell cycle is given in the figure, and the vertical arrowhead shows the time of synthesis. The time from synthesis of each gene until the beginning of G2 is shown above a horizontal line. Consider cells in M to have 4 dots (i.e., assume that the transition from 4 dots to 2 occurs at the M to G1 boundary).