CHAPTER 1: ANSWERS
Answer 1.1.
a) First let’s go through the matings, assuming pr and vg are on different chromosomes. In the following notation, alleles above the horizontal line are from one homologous chromosome, and alleles below the line are from the other homologous chromosome.
Parents: pr vg x pr+ vg+
pr vg pr+ vg+
F1: pr vg
pr+ vg+
F1 backcross: pr vg male x pr vg female
pr+ vg+ pr vg
Expect in F2: male gametes:
pr vg pr vg+ pr+ vg pr+ vg+
_________________________________________
female gametes pr vg | pr pr vgvg pr pr vg+vg pr+pr vgvg pr+pr vg+vg
This predicts four different phenotypes, purple vestigial, purple long-winged, red-eyed vestigial, and red-eyed long-winged, in equal numbers (each comprising 0.25 of the progeny).
b) The actual results were markedly different. In fact none of the recombinant phenotypes, purple long-winged and red-eyed vestigial, were observed. This indicates that the purple and vestigial genes are linked. Subsequent mapping showed that they are both in the second linkage group (Drosophila has four linkage groups, corresponding to three autosomes and one pair of sex chromosomes). Note that no measurable recombination occurred between the purple and vestigial genes in this backcross; this is a peculiarity of male Drosophila and the heterogametic sex in some other species. Other experiments with heterozygous F1 females do show recombination (see part 1c).
Let's re-examine the predictions of the matings, now that it is clear that the genes are linked. In the notation below, a horizontal line with more than one gene above and below it means that the genes are linked. Again, alleles for one homologous chromosome are above the line, and those for the other chromosome are below it.
Parents: pr vg x pr+ vg+
pr vg pr+ vg+
F1: pr vg
pr+ vg+
F1 backcross: pr vg male x pr vg female
pr+ vg+ pr vg
Expect in F2: male gametes:
pr vg pr+ vg+
_____________________
female
gametes
pr vg | pr vg pr+ vg+
pr vg pr vg
Thus in the absence of recombination, one obtains equal numbers of purple vestigial and red-eyed long-winged flies in the progeny.
c) In this case, the mating is
F1 backcross: pr vg female x pr vg male
pr+ vg+ pr vg
and recombination does occur (as mentioned in 1.1b, the absence of recombination is peculiar to male Drosophila). Note that the frequency of recombinant types is much less than the 50% predicted for no linkage (see 1.1a). The purple long-winged flies have the genotype
pr vg+
pr vg
and red-eyed vestigial flies have the genotype
pr + vg
pr vg
in both cases resulting from recombination between the purple and vestigial genes. The combined number of recombinants comprises 15.2% of the progeny, and one concludes that the two genes are linked, and are 15.2 map units, or 15.2 centiMorgans apart.
Answer 1.2
a) Mutations 1, 3 and 5 are in the same complementation group.
b) The minimal number of steps in the pathway is 3, the number of complementation groups. Note that mutations 1, 3 and 5 comprise one complementation group, 2 is a second, and 4 is a third.
Answer 1.3. The two mutations in the different genes are further apart than the two mutations in the same gene. Recombination occurs more often between genes that are further apart on a chromosome.
Answer 1.4 A substance that allows a mutant to grow is a metabolic intermediate involved in reactions downstream of the step catalyzed by the enzyme altered in that mutant. The results show that a mutant in complementation group A is incapable of growth when provided with any of the three metabolic intermediates, substances A, B, and C. Thus the gene altered in this mutant must encode an enzyme that catalyzes a step downstream of those that generate substances A, B or C. So one can place enzyme A at the end of the pathway, presumably catalyzing the final formation of serine, and substance A that accumulates in this mutant is the immediate precursor to serine. (Saying enzyme A is at the end of the pathway assumes that a saturation mutagenesis was carried out and that no other genes are in the pathway. More accurately, enzyme A is the most terminal enzyme in the group analyzed in this experiment). Since substance A accumulated in mutants in complementation group A, it is the substrate for this final reaction. Thus we can conclude from the results with mutant A that the order of intermediates and product is (B or C) ® A ® Ser.
This conclusion is confirmed by the observation that substance A will allow mutants in complementation groups B and C to grow, so production of substance A is downstream of the steps catalyzed by enzymes B and C. In fact, one of those enzymes should catalyze formation of substance A.
Substance A will allow a mutant in complementation group C to grow, but not mutants in the other complementation groups. Thus production of substance A is downstream of the step catalyzed by enzyme C, production of substances B and C are upstream of this step. This result is consistent with enzyme C catalyzing the formation of substance A. The order of intermediates and products appears to be B® C ® A ® Ser.
This conclusion is confirmed by the fact that mutants in complementation group B will grown when provided either substances C or A, again showing that production of these substances is downstream of the step catalyzed by enzyme B. Note that none of the auxotrophs will grow when provided with substance B, showing that its production is upstream of all three steps. If all steps are present, it is the first compound in the pathway.
[Note that you can analyze these results column by column or row by row. Whichever way you start the analysis (e.g. column by column), you can use the results with the other approach (e.g. row by row) to confirm your conclusions.]
Answer 1.5
a) The initial cross between the parental strains
CC shsh (colored shrunken) x ccShSh (white nonshrunken)
yield F1 progeny with the genotypes Cc Shsh, which has the new phenotype colored nonshrunken. A cross between the F1 and a homozygous recessive strain
Cc Shsh x cc shsh
would
be expected to give equal frequencies of the four possible phenotypes if the
genes are not linked.
C
Sh C
sh c
Sh c
sh
______________________________________________
c sh | Cc Shsh Cc shsh cc Shsh cc shsh
The phenotypes would be colored nonshrunken, colored shrunken, white nonshrunken and white shrunken.
b) The observed frequencies differ dramatically from the prediction of independent assortment, and in fact the parental phenotypes (colored shrunken and white nonshrunken) predominate in the progeny. This indicates that the genes are linked. The linkage relationships are indicated in the following diagrams of the crosses.
Parents C sh x c Sh
C sh c Sh
F1 C sh backcrossed to c sh
c Sh c sh
Number of plants
Progeny will have parental chromosomes: C sh 21,379 colored shrunken
c sh
and
c Sh 21,096 white nonshrunken
c sh
as well as recombinant chromosomes: C Sh 638 colored nonshrunken
c sh
and
c sh 672 white shrunken
c sh
The total number of plants counted is 43,785. Recombinant phenotypes (colored nonshrunken and white shrunken), which result from the recombinant chromosomes, were seen 1310 times (638+672 = 1310). Thus the recombination frequency between the two genes is (1310/43,785) x 100 = 3%. The two genes are 3 map units or 3 centiMorgans apart.
Answer 1.6
a) Recombination between the two parental chromosomes in the F1 hybrid accounts for the new phenotypes (reflecting the new genotypes) in the F2 progeny. Let's look at AB/AB x ab/ab in more detail, using the notation of a horizontal line to represent the chromosome on which the genes are linked (alleles from one homolog are above the line, alleles from the other are below the line).
The F1 AB is crossed with ab
ab ab
In the absence of recombination, one expects
AB and ab to occur all the time.
ab ab
Note that each of these diploid genotypes will produce the parental phenotypes. What the problem tells you is that recombination occurred between the A and B genes, i.e.
A B A b
x -->
a b a B
to produce gametes carrying Ab and aB . (In this notation just used, the horizontal lines represent each homologous chromosome, and the x depicts the position of a crossover event, or recombination between the two chromosomes.) The products of the recombination are seen in the F2 generation as
Ab and aB
ab ab
These recombinants occur in 30% of the progeny from the AB x ab cross.
ab ab
Likewise, recombinants occur in 10% of the progeny from the AC x ac cross,
ac ac
and recombinants occur in 25% of the progeny from the BC x bc cross.
bc bc
The latter two cases indicate that recombination has occurred between genes A and C and between B and C, respectively.
b) There are many more sites for potential recombinations (recombination can occur at each nucleotide pair) than there are actual recombination events during meiosis. Thus the further apart two genes are, the more likely it is that recombination will occur between them. Thus recombination frequency should be proportional to the distance between the two genes.
For the three genes in this problem, genes A and B have the largest distance between them (30% recombination frequency), genes B and C are less far apart (25% recombination frequency), and genes A and C are the closest together (10% recombination frequency).
c) The linkage map shown below fits the data given:
A____10%___C____________25%_____________B
_________________30%______________________
Note that the distances between the genes are roughly, but not precisely, additive.
Answer 1.7
a) The probability that both independent events will occur is the product of the individual probabilities, which are the individual frequencies of recombination. Using the notation described in the problem, this product is
(ac )(cb).
b) The combined probabilities will be the same as in part 1.4.a, i.e.
(cb)(ac).
c) This relationship can be expressed as
ab = ac + cb - 2(ac)(cb)
Using the numbers from problem 3, we obtain
0.30 = 0.10 + 0.25 - 2(0.10)(0.25)
0.30 = 0.35 - 0.05
0.30 = 0.30
So the observed frequency of recombination between the outside markers A and B was decreased by multiple crossovers from 35% to 30%.
d) A better estimate of distance between genes A and B is 35%, the sum of the recombination frequencies between A and C and between C and B. The effect of multiple crossovers gets larger as genes are further apart. The additive nature of recombination frequencies allows one to construct large linkage maps. As you probably realize by now, a recombination frequency greater than 50% cannot be measured in a cross between two members of a diploid species (do you see why?), but genetic distances greater than 50 map units (or centiMorgans) between genes can be mapped using the combined recombination data for genes that occupy shorter intervals between them.
Answer 1.8
a)
1- 3- 2-
| | |
0.099 0.001
b)
1) Mutations 1 and 2 are in different genes, since they complement in trans. They encode diffusible products.
2) Mutations 1 and 3 are in different genes.
3) Mutations 2 and 3 are in the same genes; they do not complement in trans.
Answer 1.9
a) 1 and 4 do not complement (the total number of phage is the same as the number of wild-type recombinants), 2 will complement 1, 3 and 4 (each pairwise co-infection gives 1010 total phage), and 3 will also complement all other mutants (1, 2 and 4). Thus mutants 1 and 4 are in the same complementation group, which is distinct from the two other complementation groups represented by mutant 2 and by mutant 3. One concludes that there are at least three genes (complementation groups) in the pathway for growth on the restrictive host.
b) Mutations 1 and 4 have the shortest distance between them, as shown by the fact that mutants 1 and 4 have a lower recombination frequency than any other pairwise co-infections. (Note that 1 and 4 are in the same complementation group.)
c) Mutations 1 and 3, as well as 3 and 4, have a higher recombination frequency than other pairwise combinations. In both cases, the co-infections generated 107 wild-type recombinants, so both pairs are equally far apart.
d) A correct map is shown below. In this diagram, the vertical bars mark the ends of the genes. The number of the mutant indicates positions of the mutations. Note that in this map, mutations 1 and 4 are in the same gene, and the distances between the genes fit the recombination frequencies.
Gene A Gene B Gene C
|__4__1__|_____|___2__|________|___3_____|
Answer 1.10.
a. The induced mutation hypothesis says that there is a certain probability that a cell will mutate to phage resistance in the presence of the selective agent, i.e. the infecting phage. Every cell in the culture has the same probability of undergoing this mutation, and the presence of the phage induce them to mutate. These mutations then would occur simultaneously in all the cultures, when the phage are added. Thus if the probability of mutating to phage resistance is about 1 in 107 and 108 bacteria are examined in each culture, then each culture should generate about 10 resistant colonies. The number of resistant colonies per culture should be normally distributed around 10 as the mean.
In contrast, if mutations arise spontaneously, not as a response to selection, then they should occur at any time in the growth of the culture. All the progeny of a resistant cell (a clone) will also be resistant. In some cultures, the spontaneous mutation to phage resistance occurs in a cell early in its growth, and as this resistnat clone propogates, many more resistant cells are produced. In other cultures, the mutation to resistance occurs later, or not at all. When the selective agent is added (the T1 phage), the cultures that acquired resistant clones early in their growth will make many resistant colonies on the selective plates. These will be "jackpots" with many T1r colonies. Those cultures that acquired resistant clones late in their growth will make few resistant colonies. The number of colonies of resistant bacteria will fluctuate, depending on when the spontaneous mutation occurred. The distribution of numbers of resistant bacteria in cultures should form a Poisson distribution.
b. Different cultures vary dramatically in the numbers of resistant cells, with some “jackpots” with many resistant colonies seen. In fact, the actual results in the table fit a Poisson distribution, as predicted by the spontaneous mutation hypothesis. Hence one concludes that mutations arise spontaneously, not in response to selection.
ANSWERS
CHAPTER 2
STRUCTURES OF
NUCLEIC ACIDS
2.1 Almost 1/10 of the volume of the nucleus is occupied by DNA. This is calculated in the following analysis.
The volume of a cylinder, Vc, can be determined from knowing its radius, r, and its length, l:
Vc = p r2 l
Consider DNA to be a cylinder whose r is 0.95 nm (the diameter of B form DNA is 1.9 nm). The length is determined by the number of base pairs; B form DNA has one bp every 0.34 nm. We will treat the volume of the nucleus in mm3, so the dimensions should be expressed in mm (1 mm = 1000 nm). The volume of cylindrical DNA with 6 billion base pairs is:
Vc = p (9.5´10-4 mm)2 (6´109 bp ´ 3.4´10-4 mm/bp)
Vc = 5.78 mm3
Consider the nucleus to be a sphere whose radius, r, is 2.5 mm. The volume of the sphere, Vs, is given by
Vs = 4/3 ´ pr3
Vs = 4/3 ´ p ´ (2.5 mm)3
Vs = 65.4 mm3
The fraction of the volume of the nucleus occupied by this volume of DNA is:
= = 0.088, or almost 0.1
2.2 (a) The complementarity between A and T, and between G and C, in the two strands of duplex DNA explained Chargaff's rules, i.e. that the sum of pyrimidine nucleotides equals that of the purine nucleotides in DNAs from (virtually) all species. A=T, G=C, and A+G=C+T for duplex DNA. The fraction of M13 that is A (23%) does not equal that of T (36%), nor does that of G (21%) equal that of C (20%). A+G = 44%, whereas C+T = 56%. This lack of equality between purine nucleotides and pyrimidine nucleotides shows that M13 DNA is not double stranded, because it does not show the relationships expected as a result of complementarity between the two strands of duplex DNA.
(b) Let’s use the percentages as an average number
of a specific nucleotide per 100 nucleotides, so 23% A is the same as 23 A’s
for every 100 nucleotides. Each A on the viral strand corresponds to a T on the
complementary strand, and each T on the viral strand corresponds to an A on the
complementary strand (Chargaff’s rules). So in duplex form there will be 23 A’s
on the viral strand and 36 A’s on the complementary strand (determined by the
number of T’s on the viral strand). This gives (23+36)/200 = 0.295, or 29.5% A
for the 100 nucleotides on the viral strand plus the 100 nucleotides on the
complementary strand. Likewise, the T composition is (36+23)/200 = 0.295, or
29.5%. The G composition is (21+20)/200 = 0.205. or 20.5%. The C composition is
(20+21)/200 = 0.205. or 20.5%. Note that the mole fractions of A=T and G=C.
2.3
Here is a simple example. See how the base composition differs for a short single strand:
A G C T
AGGGCTAAGC 30% 40% 20% 10%
versus the double strand form:
AGGGCTAAGC 20% 30% 30% 20%
TCCCGATTCG
The duplex will have a different base composition than the single strand, and it shows equality between the compositions of the complementary nucleotides.
2.4. a)
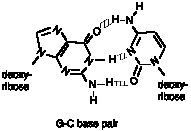
b)
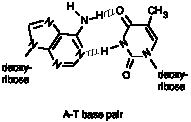
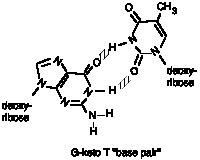
c) The T has to be moved considerably, relative to its position in an A-T base pair, in order to get H-bonding with G. This is most easily seen by examining the position of the N-glycosidic bond from T to the the deoxyribose. Note how it is displaced "upward" relative to that seen for the A-T base pair. The DNA would have to be distorted greatly to accomodate this alteration, and indeed G does not pair with ketoT in duplex DNA.
d) Now with the T in the enol tautomer, 3 H-bonds can readily be formed with G, without distortion of the DNA duplex. Thus if T shifts to the enol conformation after incorportation into DNA, it will pair with G during replication, and thus cause an alteration in the sequence, i.e. a mutation.
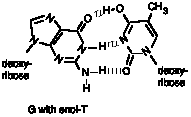
This exercise should also illustrate the importance of using the correct tautomers of the bases in deducing a structure for DNA. Watson and Crick were initially building their model in the early 1950's with the enol tautomers, and were unable to make their model fit with Chargaff's rules. They were greatly aided by a colleague who pointed out to them that the keto tautomers were greatly favored - and have the opposite base pairing properties to the enol tautomers!
2.5 a) In terms of nearest neighbor frequencies (or dinucleotide frequencies):
Same orientation Opposite orientation
TpA = ApT TpA = TpA
ApG = TpC ApG = CpT
GpA = CpT GpA = TpC
ApC = TpG ApC = GpT
b) The data support an antiparallel polarity to the DNA strands. Using the predictions in part a), we see that, in terms of frequency,
TpA = TpA, 0.012 = 0.012
ApG = CpT, 0.045 = 0.045
GpA = TpC, 0.065 = 0.061
ApC = GpT, 0.064 = 0.060
The predictions of the parallel polarity, or same orientation, are not observed. You should check this for yourself.
(c.1.) The radioactive phosphate has been transferred from the 5’ position of the labeled nucleotide to its nearest neighbor on the 5’ side.
Consider the following DNA segment made in the presence of [a32P]dATP.
5’ pGpCpCpT*pApG 3’
(The * means the adjacent p, or phosphate, is labeled).
After cleavage to generate deoxynucleoside-3’-monophosphates (or 3’ mononucleotides), one has the following:
5’ pGp/Cp/Cp/T*p/Ap/G 3’
or 2 moles of Cp, 1 of Ap, and 1 of Tp, and only the Tp is labeled. The 5’ terminal G ends up as pGp, and the 3’ terminal G has no phosphate.
Note that the label originally with the [a32P]dATP is now with the deoxythymidine-3’-monophosphate.
(c.2.) Since the label is transferred to the nucleotide on the 5’ side of the originally labeled nucleotide, these data provide information on
TpA, ApA, CpA, and GpA.
(c.3.) To obtain the frequency of occurrence of each dinucleotide, simply multiply the fraction of label that is in each mononucleotide by the mole fraction of A in the genome, i.e. multiply the number given in the problem by 0.162. The results are
TpA 0.012
ApA 0.024
CpA 0.063
GpA 0.065
Analysis of the results using labeled dTTP, dGTP and dCTP gave the results quoted in part b.
2.6 (a) False. Adjacent nucleotide pairs are off-set from each other. The rotations between nucleotide pairs is 1/10 of the rotation of a full circle, since there are 10 nucleotide pairs per turn of the double helix. Thus this rotation between adjacent nucleotide pairs is 360o/10 = 36o.
(b) True. Nucleic acids in the A form, such as RNA-RNA hybrids, have a wider diameter and more base pairs per turn.
(c ) True. The guanine base is rotated back over the deoxyribose in Z DNA.
2.7 a) True
b) False
c) False
2.8 a) A is larger than B, and the G+C content of B is greater than that of A.
b)

2.9 a) circular (uncut runs faster than linear).
b) BamHI, HindIII, EcoRI
c) PstI (runs like uncut)
d)

2.10 a) AA BB CC DD AB AC AD BC BD CD
17.5 -- -- -- -- -- -- --
15.0 -- -- -- -- -- -- --
8.4 -- -- -- -- -- -- -- -- -- --
4.9 -- -- -- -- -- -- --
3.7 -- -- -- -- -- -- --
2.3 -- -- -- -- -- -- -- -- -- --
1.2 -- -- -- -- -- -- --
AD and BC are identical. The rest are different.
b) The differences in restriction sites come from differences in DNA sequence. There is no evidence on which to base a judgment of either trivial or potentially adaptive differences.
c) The sequence that gave rise to the G8 probe is located on chromosome 4.
d) For each family, construct a 2 x 2 table for each polymorphism. Do not include people who marry into the family. This is done below for the relevant polymorphism in each family.
Venezuela
Disease No disease Total
C present 19 1 20
C absent 0 15 15
Total 19 16 35
United States
Disease No disease Total
A present 13 6 19
A absent 0 1 1
Total 13 7 20
Huntington’s disease is linked with haplotype C in the family from Venezuela and with haplotype A in the family from the United States.
e) The G8 probe can be used to identify the region in which the Huntington’s disease gene is located. The locus can be isolated by means of chromosome walking. The gene can be transcribed and translated, and the protein product can be identified.
f) In the Venezualan family, individual VI, 5 (Roman numerals refer to the generation, Arabic numbers denote the position from left to right on that row) has the genotype AC at the G8 locus, but is not affected with Huntington's disease. This is an exception from the association of the C allele at the G8 locus with Huntington's disease in this family. However, a single reason for this exception cannot be ascertained because the genotypes of the parents are not known. This exception could result from a crossover (that is, a recombination between homologous chromosomes during meiosis) between the C allele at G8 and the disease allele at the HD locus. If so, then in the family from Venezuela, there is one crossover individual among the 20 that carry the C polymorphism. That interpretation would place the G8 probe is 100% ´ (1/20) = 5 m.u. from the Huntington’s disease gene. However, this is not the only explanation (i.e. this individual does not represent an obligate crossover).
This conclusion requires analysis of the known and possible genotypes for this branch of the family in generations V, VI and VII. Since all the affected progeny for two generations have the C allele at G8, then one of the affected mother's (V, 3) chromosomes is most likely C__- . In this notation, the genotype at the G8 locus is given first, followed by an underscore, followed by the genotype at the HD locus. I'll use - to denote the disease allele, and + to denote the wild-type allele at HD. One of her offspring (individual VI, 7) is AA (and unaffected), so let's assign the other maternal chromosome as A__+ (i.e. A haplotype at G8, and the wild-type allele at the linked HD locus). We can infer that one of the unaffected father's (V, 4) chromosomes is A__+, again because of the unaffected homozygote AA (individual VI, 7). However, we don't know the genotype of the other paternal chromosome. If it were also A__+, then you have to invoke a crossover between the G8 locus and the HD locus in the mother to explain the unaffected daughter VI, 5, who has the genotype AC at the G8 locus.
These chromosome pairs and recombinations are diagrammed below. Chromosome 4 is represented as a horizontal line. The allele at the G8 locus (A or C) is given in the center of the line and the allele at the HD locus (- or +) is given toward the right.
Affected mother
_______C___-__
_______A___+__
Unaffected father
_______A___+__
_______A___+__
Progeny explained without invoking crossover, i.e. simply
bring together one maternal and one paternal chromosome in the offspring:
Affected offspring VI, 1, 3, 4, 5; all are AC:
_______C___-__
_______A___+__
Unaffected son VI, 7, who is AA:
_______A___+__
_______A___+__
To explain the unaffected daughter VI, 5, who is AC, you
have to get the C allele from the mother, but not bring along the disease
allele (- at HD).
If a recombination occurred during meiosis in the mother between G8 and HD, then the C allele at G8 will be linked to the wild-type
allele at HD,
and the A allele at G8 will be linked to the disease allele at HD.
Recombinants from the mother:
_______C___+__
_______A___-__
Then one can explain the unaffected son VI, 7 (AC) as
inheriting the recombinant C__+ chromosome from the mother and the A__+
chromosome from the father.
However, if the unaffected father were C__+ and A__+, then the unaffected son could simply be explained by inheriting C__+ from the father and A__+ from the mother. Thus not knowing the genotypes of the parents makes it impossible to give a single explanation for the exceptional individual.
In the American family, there are 6 individuals with the A allele at the G8 locus who do not have the disease, and one without the A allele who does have the disease. Thus 7 individuals are exceptions to the association of the A allele (at G8)with the disease allele at HD. On four occassions, unaffected individuals carrying the A allele married into the affected family, which makes it impossible to determine obligate crossover events. Also, as discussed for the exceptional cases in the Venezuelan family, in several cases the genotypes of the parents of the exceptional individual are unknown.
Let's illustrate this with one example, unaffected individual IV, 6, who is AA. He has two brothers, both affected and both AA. The genotypes of the parents are unknown at the G8 locus, but the mother (III, 4) has the disease allele at HD, whereas the father (III, 5) is unaffected. This pattern can be explained by the affected mother being homozygous AA at the G8 locus and heterozygous at the linked HD locus, i.e. A__- on one chromosome 4 and A__+ on the other. The father has to be A__+ on at least one chromosome 4. The affected sons inherited A__- from the affected mother, whereas the unaffected son inherited A__+.
(Solution to parts a-e is from Diane K. Lavett; f is from RCH)
2.11 One possibility is that I is RNA (since it is much more dense than II) and II is DNA. II separates into two components, one fast sedimenting and the other slow sedimenting. Since the problem tells you that the two components are the same length, then they are separating on the basis of shape. More compact DNA, such as supercoiled circles, sediments faster than more extended DNA, such as linear or relaxed circular DNA. So one could assign IIF as supercoiled and IIS as linear or relaxed circular DNA. Another possibility is that I is DNA, but more G+C rich.
2.12 a) = +40
b) -2
c) L = T + W = 40-2 = +38
2.13 In relaxed DNA, the linking number (L) is equivalent to the number of turns in the DNA helix. Linking number is a topological property, which means it does not vary when duplex DNA is twisted or deformed in any way, as long as both DNA strands remain intact. L can change only if one or both strands are broken and rejoined. If a DNA strand remains broken, then the molecule is no longer topologically constrained (the strands can unravel) and L is undefined. DNA gyrase is a type 2 topoisomerase that can use the energy of ATP to introduce negative supercoils (underwind the DNA).
The L of the relaxed DNA is 500, the L of relaxed DNA is equivalent to the number of turns of DNA, and there are about 10 base pairs per turn of relaxed B form DNA, then the DNA has approximately 5000 base pairs (i.e. 500 x 10). For the four treatments, L will
a) not change, since the DNA strands were not cleaved and reformed (L is a topological property).
b) become undefined, since one of the strands has a break.
c) decrease, because in the presence of ATP, gyrase will underwind the DNA.
d) not change; again the DNA strands were not broken and rejoined.
2.14 W increases by 22.
DT = TZ - TB = - 10 - (+12) = -22
DL = 0, so DW = -DT = -(-22) = +22
Note that Z DNA has a left-handed twist with 12 bp/twist, or 10 left-handed twists in 120 bp, so TZ = -10. B DNA has a right-handed twist with 10 bp/twist, or 12 right-handed twists per 120 bp, so TB = +12.
2.15 In this operation, there was no opening and closing of DNA, so
DL = 0
DL = DW + DT
DT = -DW
DW = Wfinal - Winit = 0 - (-5) = +5
DT = -5
DT = -5 twists (360o/twist) = -1800o
Ethidium bromide unwinds -27o/molecule, so one needs
= 66.7 or about 67 molecules
2.16 a) is correct. More ethidium bromide will intercalate (per nucleotide) in linear DNA molecules than circular, giving a lower density for the complex of linear DNA and ethidium bromide.
ANSWERS
CHAPTER 3
ISOLATION AND
ANALYSIS OF GENES
3.1. Insertion into the EcoRI site leaves both resistance genes intact, so any recombinant plasmids will confer the same genotype as the parental pBR322, i.e. resistance to both drugs. Insertion into the PstI site will give plasmids that confer resistance to tetracyline but are now sensitive to ampicillin. Thus by replica plating on plates with either ampicillin or tetracycline, one can screen for colonies of bacteria carrying plasmids with inserts.
3.2. Type II restriction enzymes cleave double‑stranded DNA within recognition sequences to create either blunt-ended DNA or sticky-ended fragments. Blunt-ended DNA fragments can be joined together by the action of T4 DNA ligase. Sticky-ended DNA fragments can be joined together by either E. coli or T4 DNA ligases provided that the sticky ends are complementary. Sticky-ended DNA fragments without complementary sticky ends can be joined together only after the ends are made blunt ended either by exonucleases or E. coli DNA polymerase I.
a) The recognition sequence for EcoRI is (5’) GAATTC (3’), with the cleavage site between G and A. Thus, digestion of a DNA molecule with one EcoRI site
(5’) ‑‑‑‑‑‑‑‑‑‑GAATTC‑‑‑‑‑‑‑‑
(3’)
‑‑‑‑‑‑‑‑‑‑CTTAAG‑-‑‑‑‑‑‑
would yield two fragments:
(5’) ‑‑‑‑‑‑‑‑‑‑G (3’) and (5’)AATTC‑‑‑‑‑‑‑
(3’)
‑‑‑‑‑‑‑‑‑‑CTTAA G‑‑‑‑‑‑‑
b) DNA polymerase I catalyzes the synthesis of DNA in 5’ to 3’ direction in the presence of four deoxyribonucleoside triphosphates. Therefore, the ends of both fragments generated in (a) will be made blunt ended as shown below.
(5’) ‑‑‑‑‑‑GAATT
(3’) and (5’)AATTC‑‑‑‑‑
(3’)
‑‑‑‑‑‑CTTAA TTAAG‑‑‑‑‑
c) The two fragments generated in (b) can be ligated by T4 DNA ligase to form:
(5’) ‑‑‑‑‑‑‑‑GAATTAATTC‑‑‑‑‑‑
(3’)
‑‑‑‑‑‑‑‑CTTAATTAAG‑‑‑‑‑‑
Note that the EcoRI site is no longer present.
d) In order for the DNA fragments shown in (a) to be joined with a DNA fragment generated by PstI digestion, a conversion adaptor has to be used; this adaptor should contain a single‑stranded region complementary to the sticky end of EcoRI generated DNA fragment, and a single‑stranded region complementary to the sticky end generated by PstI digestion. The two adaptor sequences that fulfill this requirement are shown below, in order of discussion in the problem (N = any nucleotide).
(5’) AATTCNNNNCTGCA
GNNNNG
(5’) AATTGNNNNGTGCA
CNNNNC
Ligation of the first adaptor to the EcoRI digested DNA molecule would yield:
(5’) ‑‑‑‑‑‑GAATTCNNNNCTGCA
(3’)
‑‑‑‑‑‑CTTAAGNNNNG
This DNA molecule can now be ligated with a DNA fragment produced by a PstI digest which has the terminal sequence:
(5’) G‑‑‑‑‑‑ (3’)
ACGTC‑‑‑‑‑‑
to yield:
(5’) ‑‑‑‑‑‑GAATTCNNNNCTGCAG‑‑‑‑
(3’)
‑‑‑‑‑‑CTTAAGNNNNGACGTC‑‑‑‑
Notice that both EcoRI and PstI sites are retained.
In a similar fashion, the other adaptors can each be ligated to the EcoRI digested DNA molecule, and the ligated DNA molecule can be subsequently joined to a DNA fragment produced by a PstI digest. The final product is:
(5’) -----GAATTGNNNNGTGCAG----- (3’)
-----CTTAACNNNNCACGTC-----
(Notice that neither the EcoRI nor the PstI site is retained.)
3.3. Vectors must be autonomously replicating, they must carry a selectable (e.g. drug resistance) or screenable (e.g. b-galactosidase) marker, and they must have unique restriction sites for insertion of DNA fragments. They need not be circular or of bacterial origin (although frequently they are).
3.4. The student should pick the white colonies that are ampicillin resistant. Blue colonies are producing b-galactosidase, meaning they have an "intact" lacZ gene. Recombinants have an insert that should inactivate the lacZ gene, producing white colonies.
3.5. 1) Reverse transcriptase to copy the RNA; synthesis of the first strand cDNA is primed by oligo (dT).
2) After treatment with alkali to remove the RNA, DNA Polymerase I is used to synthesize the second strand, usually from a fortuitous hairpin at the end of the cDNA (corresponding roughly to the 5’ end of the mRNA).
3) S1 nuclease to digest the hairpin.
4) Terminal deoxynucleotidyl transferase plus dCTP to add a homopolymer of (dC)n to the 3’ ends of the duplex cDNA. This will anneal to the oligo (dG)-tailed vector.
3.6. Any of the following, or combinations of them, could be used.
1) Hybridize with a labeled synthetic oligonucleotide whose sequence was deduced from the amino acid sequence of giraffe actin. One could also use as a probe a PCR product made by amplification of sequences between oligonucleotides.
2) Screen for actin antigenic determinants expressed in transformed E. coli by reacting with the anti-actin antibodies.
3) Hybridize with a labeled cDNA for actin from another mammal (e.g. mouse or human) but the cDNA insert must be free of the vector sequences which would cross-hybridize with the pBR322 in your cDNA library.
3.7. a) The cDNA insert is 600 bp (data from PstI digest).
b) HindIII and BamHI cleave within the cDNA insert. A digest with either of these enzymes alone generates two DNA fragments that hybridize with the cDNA, thus the insert must be cut by the enzyme. Also, in the double digests PstI plus HindIII and PstI plus BamHI, the sum of hybridizing bands is 600 bp, the same as the insert size. This is 500 bp + 100 bp for PstI plus HindIII, which tells you that the HindIII site is 100 bp from one end of the insert. The two fragments are 400 bp + 200 bp for the PstI plus BamHI digest, which tells you that the BamHI site is 200 bp from one end of the insert. Additional information is needed to order the HindIII and BamHI relative to each other.
c) The 4060 bp HindIII fragment is cut by PstI into 3560 bp + 500 bp, and the 500 bp fragment hybridizes to cDNA.
The 900 bp HindIII fragment is cut by PstI into 800 bp + 100 bp, and the 100 bp fragment hybridizes to cDNA.
The 3500 bp BamHI fragment is cut by PstI into 3300 bp + 200 bp, and the 200 bp fragment hybridizes to cDNA.
The 1460 bp HindIII fragment is cut by PstI into 1060 bp + 400 bp, and the 400 bp fragment hybridizes to cDNA.
.
d) The map is shown below.
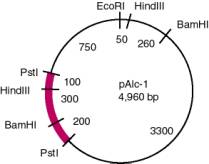
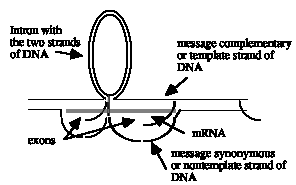
3.8. The distance from BamHI to HindIII is 800 bp, and an internal Eco-Sal fragment does not hybridize to mRNA. Therefore, the gene has an intervening sequence (or intron) of 800-300 = 500 bp. (Recall from the pAlc-1 map in 1.37 that the distance between BamHI and HindIII is 300 bp in the cDNA).

3.9. Amino acids are encoded by triplets of three nucleotides. The coding regions of many eukaryotic genes are interrupted by introns, which are segments of noncoding DNA.
The 192 amino acids can be encoded by 576 nucleotide pairs, but the gene is longer (1440 nucleotide pairs). The additional 864 nucleotide pairs could be in introns, or they could code for a signal sequence (or leader peptide). Eukaryotic mRNAs have untranslated segments before and after the portion coding for the polypeptide chain; these also contribute to the "extra" size of genes.
3.10. The actin gene has two introns.
3.11. a) The sequence of the top strand at the left of the cDNA is 5'GGGGGGGAGGCCTCTAGAT and the sequence of the bottom strand at the right of the cDNA is 5'TTTTTTTTTAGGCGCTTTA.
b) The right end end contains the sequence synonymouse with the 3' end of the mRNA. Almost all eukaryotic mRNAs have a polyA tail at their 3' ends. Since the cDNA was synthesized with oligo-dT as the primer for first strand synthesis, it is highly likely that most of the cDNA clones will contain the sequences from the 3' end. (The same cannot be said for the 5' end of the mRNA, unfortunately - do you see why? Think about the steps required for second strand synthesis, and processivity of the polymerase, i.e. its capacity to catalyze synthesis of long stretches of DNA.) The sequence generated by the right-hand primer for the bottom strand at the right end has a string of T's at its 5' end, which could be complementary to the 3' polyA of the mRNA. Techniques discussed in Part Two will allow this to be tested definitively.
c) An XbaI cleavage site (TCTAGA) is close to the left end of the cDNA insert and a HhaI cleavage site (GCGC) is close to the right end.
3.12. a)
*hybridizes *hybridizes
EcoRI 5kb 1kb 3kb 4kb EcoRI
Left arm ___| | | | |_ Right arm
(30 kb) (6 kb)
b) The R-loops indicate two separate genes with at least one intron in each. This does not look like one single gene, since duplex, unlooped DNA separates the two R-loop structures; within a gene, all the DNA should be either in hybrid with RNA (and visible by the loop from the displaced, nontemplate DNA strand) or in introns looping between the exons. The R-loop for each gene can be interpreted as follows:
c) Maps of the two genomic EcoRI fragments that hybridize to the cDNA:
5 kb EcoRI fragment: 4 kb EcoRI fragment:
kb: 2.5 2.0 0.5 1.5 2.0 0.5
EcoRI SalI HindIII EcoRI EcoRI HindIII SalI EcoRI
|_____________|___________|___| |_________|____________|___|
Maps rotated 180o also fit the data.
d) The distance between SalI and HindIII in the cDNA clone is 1.3 kb, and the exons extend at least 0.4 kb to the "left" of SalI and 0.3 kb to the "right" of HindIII. Both the hybridizing genomic DNA fragments have these two restriction endonuclease cleavage sites 2.0 kb apart, i.e. they contain an intron. All the data are consistent with a single intron of 0.7 kb in each of the two yellow genes, as diagrammed below. The precise intron/exon junctions in the two SalI to HindIII fragments cannot be determined from the data given.
5 kb EcoRI fragment: 4 kb EcoRI fragment:
kb: 2.5 2.0 0.5 1.5 2.0 0.5
EcoRI SalI HindIII EcoRI EcoRI HindIII SalI EcoRI
|_____________|___________|___| |_________|____________|___|
| | | | | | | |
exon "1" exon "2" exon "2" exon "1"
e) The R-loops indicate that there are two yellow genes in this clone, and both the R-loops and the blot-hybridization data comparing genomic and cDNA clones indicate that each gene has at least one intron of 0.7 kb. The 5 kb and the 4 kb EcoRI fragments are separated by 4 kb in the map of the genomic DNA clone, so these two genes are at least this far apart. Once the orientations (5' to 3') of the genes in the maps in part d) are known, then the non-genic portions of the appropriate terminal fragments can be added to the 4 kb minimal distance to obtain a more accurate measure of the distance between the genes.
3.13. a) The restriction map of the 3000 bp SalI to SalI genomic DNA fragment from the azurre gene is shown below.
![]()
A map with the sites flipped 180° also fits the data.
b) 1 intron is present.
c) In the map below, the exons are boxed. The 400 bp exon is split by the BamHI site, and the 600 bp exon is split by the EcoRI site. The 1500 bp intron is cut by Pst I.

3.14. Mark Davis and his colleagues used this approach to successfully isolate a cDNA clone for the T-cell receptor. In the subtractive hybridization strategy, cDNA is made from the polyA+ RNA from the T-cells. Some of this is used to construct a library of cDNA clones, and some of it is used to generate a probe containing T-cell specific cDNA (and very little cDNA from genes expressed in both T-cells and B-cells) . Radiolabeled T-cell cDNA is hybridized to an excess of polyA+ RNA from B-cells, and the hybridization is carried out long enough that even rare mRNAs from B-cells would find their T-cell complement (if present). The cDNA-mRNA duplexes, containing cDNAs that are expressed in both cell types, are retained on an hydroxyapatite column, whereas the free cDNA (containing T-cell specific cDNA) will pass through the column. This single-stranded cDNA is then hybridized again to an excess of B-cell mRNA and the unhybridized cDNA collected. This is repeated until no further reduction in the amount of unhybridized cDNA is obtained. This labeled cDNA is then used as a hybridization probe against the T-cell cDNA library to obtain T-cell specific clones. Further characterization of the clones in terms of expression patterns, DNA sequence, an ability to confer the expected phenotype when expressed in appropriate cells allowed the cDNA clones for the T-cell receptor to be identified definitively.
3.15. When you use the BLAST 2 sequences server to align L15440 and NM_000207 (INS mRNA), you find exons at:
4262-4287
4468-4671
5457-5676
The annotation for L15440 says:
exon 4247..4662
/gene="INS"
/note="INS (SWISS: P01308); G00-119-349"
/product="insulin"
gene join(4485..4662,5458..5603)
/gene="INS"
CDS join(4485..4662,5458..5603)
/gene="INS"
/note="INS (SWISS: P01308)"
Note that the annotation differs from what one deduces from the mRNA sequence. Annotaion in GenBank is not curated, and errors are in some of the annotations.
b. The ab initio exon- finding program Genscan gives results very close to those seen with the cDNA-genomic DNA alignment (3 exons).
c. Searching Ensembl for INS returns web page
http://www.ensembl.org/perl/geneview?gene=ENSG00000129965
with information including:
mRNA Total Length: 330 bp
genomic DNA No. Exons: 3
Exon Structure
ANSWERS
CHAPTER 4
GENOMES AND
CHROMOSOMES
4.1.
repetition
frequency = Rn = ![]()
s.c. = single copy
subscript n refers to the particular component, i.e. (1, 2, 3, or 4)
4.2. RepeatMasker output on the INS gene sequence 12.5 kb, with other genes present as well) shows that it is has only three repeats, a MIR, an Alu and a simple repeat. This is quite sparse in repeats.
Repeat
sequence:
SW perc perc perc
query position
in query
matching repeat
position in repeat
score div. del. ins. sequence
begin end (left) repeat class/family begin end (left) ID
455 28.2 1.0 0.0 gi|307071|gb|L15440.1
11351 11480 (1085) +
MIR
SINE/MIR 34 164 (63)
2262 10.0 0.6 0.0 gi|307071|gb|L15440.1
11811 12121 (444) + AluSp SINE/Alu 1 313 (0)
209 3.3
3.3 0.0 gi|307071|gb|L15440.1 12517 12546 (19) +
(TTTG)n Simple_repeat 2
32 (0)
Summary:
==================================================
file
name: /repeatmasker/tmp/RM2seq
sequences:
1
total
length: 12565 bp
GC
level: 64.54 %
bases
masked:
471 bp ( 3.75 %)
==================================================
number of
length percentage
elements*
occupied of sequence
--------------------------------------------------
SINEs:
2 441 bp 3.51 %
ALUs
1 311 bp 2.48 %
MIRs
1
130 bp
1.03 %
LINEs:
0
0 bp 0.00
%
LINE1 0
0 bp 0.00
%
LINE2 0
0 bp 0.00
%
L3/CR1 0
0 bp 0.00
%
LTR
elements: 0
0 bp 0.00
%
MaLRs 0
0 bp 0.00
%
ERVL
0
0 bp 0.00
%
ERV_classI 0
0 bp 0.00
%
ERV_classII
0
0 bp 0.00
%
DNA
elements: 0
0 bp 0.00
%
MER1_type 0
0 bp 0.00
%
MER2_type 0
0 bp 0.00
%
Unclassified:
0
0 bp 0.00
%
Total
interspersed repeats: 441 bp 3.51 %
Small
RNA:
0
0 bp 0.00
%
Satellites: 0
0 bp 0.00
%
Simple
repeats:
1 30
bp 0.24 %
Low
complexity:
0
0 bp 0.00
%
==================================================
* most
repeats fragmented by insertions or deletions
have been counted as one element
The
sequence(s) were assumed to be of primate origin.
RepeatMasker
version 07/16/2000
default
ProcessRepeats
version 07/16/2000
Repbase
version 03/31/2000
4.3 a) None of the preparations contains more than a single frequency class of sequences, because each shows about 80% reassociation over a two-log interval of C0t. . If more than one frequency class were present, the C0t curves would be broader.
b) Genome size for procaryotes is equal to complexity, which is proportional to C0t1/2. From the curves in Figure 1.27, the C0t1/2 values for E. coli and T4 are 8 and 0.3, respectively. Therefore the genome size of T4 is (4.5 x 10⁶)(0.3/8) = 1.7 x 10⁵ nucleotide pairs.
c) The C0t1/2 value for mouse satellite DNA is 7 x 10⁻⁴. Therefore its complexity is (4.5 x 10⁶)(7 x 10⁻⁴)/8 = 400 nucleotide pairs.
d) Mouse satellite DNA comprises (0.10)(3.2 x 10⁹) = 3.2 x 10⁸ nucleotide pairs. If the complexity of the repeating sequence is 400 nucleotides, this sequence must be repeated 8 x 10⁵ times.
e) From Figure 1.29, the complexity of the calf unique sequence fraction is (4.5 x 10⁶)(4 x 10³/8) = 2 x 10⁹. Because these sequences are present only once, they comprise 2 x 10⁹/3.2 x 109 = 60% of the calf genome.
4.4 a) (Answers in italics)
Component f Cot 1/2(measured) Cot 1/2(pure) N R
fast 0.2 10-4 2 x 10⁻⁵ 6 bp 108
medium 0.4 10-1 4 x 10⁻² 1.2 x 10⁴ 105
slow 0.4 104 4 x 10³ 1.2 x 10⁹ 1
N
component=
Nstandard
x Cot 1/2(pure) = 3 x 10⁶ bp x Cot 1/2(pure)
Cot 1/2(standard) 10
Rcomponent =
b) G = N(s.c.) = 1.2 x 109 = 3 x 10⁹ bp
ƒ(s.c.) 0.4
The sequence GACTCA,GACTCA,GACTCA (a repeat of 6 bp) could be a member for the fast renaturing component.
4.5 a) The b-globin gene is induced 50-fold. Since the background of the assay is 0, one simply can divide the cpm in induced cells (500,000) by the cpm from uninduced cells (10,000 cpm) to get a 50-fold induction. If the background were measurable, it could be subtracted from each value prior to calculating the ratio of induced to uninduced.
b) Since there are 3 mg of polyA+ RNA in 107 cells, then there are or
3x10-13 g = 0.3 pg mRNA per MEL cell.
The molecular weight of a nucleotide is 345, so the molecular weight of a 2000 nucleotide (nt) long mRNA is (2000)(345) = 690,000.
moles of mRNA cell-1 =
= 4.35x10⁻¹⁹ moles of mRNA
number of mRNAs cell-1 = (4.35x10⁻¹⁹ moles of mRNA)(6.02x10²³ molec. mole-1)
= 2.62x10⁵ molecules of mRNA per cell
c) First, calculate the fraction of the polyA+ RNA comprised by each mRNA, which is just the cpm protected by the specific probe divided by the input cpm (i.e. total input polyA+ RNA). Then multiply this fraction by the total number of mRNAs per cell calculated in part b). The following assumes that this value did not change upon induction of MEL cells (how would you test this assumption?).
For b-globin mRNA in uninduced cells, the fraction is = 0.005
and the abundance is 0.005 x 262,000 total mRNA molecules per cell = 1310 b-globin mRNA molecules per cell.
All the results are tabulated below:
|
DNA probe |
cpm protected uninduced MEL cells |
fraction unind MEL |
Abundance unind MEL |
|
[input RNA] |
[1,000,000] |
|
|
|
b-globin |
5,000 |
0.005 |
1310 |
|
GATA1 |
25 |
0.000025 |
6 |
|
ovalbumin |
0 |
0 |
0 |
|
DNA probe |
cpm protected induced MEL cells |
fraction ind MEL |
Abundance ind MEL |
|
[input RNA] |
[1,000,000] |
|
|
|
b-globin |
250,000 |
0.25 |
60,500 |
|
GATA1 |
25 |
0.000025 |
6 |
|
ovalbumin |
0 |
0 |
0 |
Note the pronounced increase in b-globin mRNA upon induction, but no change in the level of GATA1 mRNA. Also, the mRNA for GATA1, a transcription factor, is much less abundant than that encoding b-globin, which is one component of the predominant protein in erythroid cells, i.e. hemoglobin. The ovalbumin negative control confirms that this assay is specific for the mRNAs being probed for, i.e. the background hybridization is very low.
d) Many copies of a small number of mRNA and a very few copies of a large number of different mRNAs are found in most differentiated cells.
4.6 a) The protein-coding region of the gene is 1085 - 80 = 1005 nucleotides, which is 335 codons (including the initiator methionine and the termination codon). Thus the protein (including the initiator methionine) is 334 amino acids long.
b) The resulting graphical display highlights the argI gene, and shows its neighbors. One end of argI is close to nucleotide position 4475869. Scrolling on down in this window reveals a low resolution figue that shows this position on the circular chromosome.
4.7 a) The E. coli OTC protein is related to many entries in the nr database. The default limit on number of hits returned is 100, and we hit that - more are probably there with lower scores. The figure shows in a color coded fashion the positions and strengths of matching sequences, with red being the hits with the highest score, and hence least chance of being a random hit. The table under the figure shows this quantitatively. The E values are the probability that a match of this similarity score would be found in random sequences of the same length and base compositions. Since we are querying the OTC sequence against all the known protein sequences (319,187 sequences; 96,613,662 total letters, as shown at the top of the report), we get some astronomically low probabilities. An E-value of e-109 means that the probability of this match occurring randomly is 1 in 10109.
b) This entry is for a human OTC, so the E. coli protein is related to the human protein. The match is highly significant, with an E-value of 3e-42.
4.8 a) Many of the features are sequence variants associated with OTC deficiency. Mutations in the OTC gene cause an important human genetic disease.
b) The following is the begining of the OMIM entry. Note that mutations in OTC cause an an X-linked genetic disease. The symptoms are serious but treatable.
"Gene Map Locus: Xp21.1
...
TEXT
DESCRIPTION
Ornithine transcarbamylase deficiency is an X-linked inborn error of metabolism of the urea cycle which causes hyperammonemia and is treatable with supplemental dietary arginine and low-protein diet.
CLINICAL FEATURES
Russell et al. (1962) described 2 cousins with chronic ammonia intoxication and mental deterioration. By liver biopsy the activity of hepatic OTC was shown to be very low. A defect is presumed to be present in urea synthesis at the level of conversion of ornithine to citrulline. Mutation in the structural gene for ornithine transcarbamylase (OTC; EC 2.1.3.3 ) may lead to partial deficiency in heterozygous females and to complete deficiency in hemizygous males (Campbell et al., 1971). ..."
4.9 As expected, the two amino acid sequences align in a robust manner; here is the highest scoring SIM alignment:
Alignment performed with SIM program at
Michigan Tech. Univ.
Match Mismatch Gap-Open Penalty Gap-Extension Penalty
11 -4
10
2
Upper
Sequence: GI|400687|SP|P00480|OTC_HUMAN ORNITHINE CARBAMOYLTRANSFERASE
PRECURSOR (OTCASE) (ORNITHINE TRANSCARBAMYLASE)
Length: 354
Lower
Sequence: GI|40962 CODING SEQUENCE ARGI GENE
Length: 334
*********************************************************
Number 1 Local
Alignment
Similarity
Score : 442
Match
Percentage : 35%
Number of
Matches : 118
Number of
Mismatches : 185
Total Length of
Gaps : 25
Begins at (40,
7) and Ends at (343, 333)
0 . : . : . : . : . :
40
RDLLTLKNFTGEEIKYMLWLSADLKFRIKQKGEYLPLLQGKSLGMIFEKR
| | || | | | | ||-
| | | || ||||
7 KHFLKLLDFTPAELNSLLQLAAKLK
ADKKSGKEEAKLTGKNIALIFEKD
50 . : . : . : .
: . :
90
STRTRLSTETGLALLGGHPCFLTTQDIHLGVNESLTDTARVLSSMADAVL
||||| | | | | | || |||||| | |
56
STRTRCSFEVAAYDQGARVTYLGPSGSQIGHKESIKDTARVLGRMYDGIQ
100 . : . : . : . : . :
140 ARVYKQSDLDTLAKEASIPIINGLSDLYHPIQILADYLTLQEHY SSLK
| |
| ||| | | |||
|| | ||
||| --
106
YRGYGQEIVETLAQYRSVPVWNGLTNEFHPTQLIEYKLTMQEHLPGKAFN
150 . : . : . : . : . :
188 GLTLSWIGDG NNILHSIMMSAAKFGMHLQAATPKGYEPDASVTKLAEQY
|| || -|| | ||
| | | | |
156
EMTLVYAGDARNNMGNSMLEAAALTGLDLRLVAPQACWPEAALVTECRAL
200 . : . : . : . : . :
237
AKENGTKLLLTNDPLEAAHGGNVLITDTWISMGQEEEK KKRLQAFQGYQ
| || || | | || | ||| |-
|
||
206
AQQNGGNITLTEDVAKGVEGADFIYTDVWVSMGEAKQKWAERIALLAEYQ
250 . : . : . : . : . :
286 VTMKTAKVAAS DWTFLHCLPRKPE
EVDDEV
| | - |||||| -------------------|| |||
256
VNSKMMQLTGNPEVKFLHCLPAFHDDQTTLGKKMAEEFGLHGGMEVTDEV
300 . : . : .
316 FYSPRSLVFPEAENRKWTIMAVMVSLLT
| | | || |||| || |||| |
306 FESAASIVFGQAENRMHTIKAVMVATLS
The invariant string FLHCLP at human positions 300-305 caught my eye. This segment shows six adjacent amino acids with NO changes from bacteria to man (a span of perhaps as much as 3.9 billion years), in a region with a large number of other identities. This is likely conservation because this sequence is needed for the function of the enzyme. I checked the features table in the human sequence, and sure enough, mutations at positions 302, 303, and 304 all are associated with OTC deficiency in humans.
From the GenBank entry:
" Region 302
/note="H -> Y (IN OTC DEFICIENCY; NEONATAL)."
/region_name="Variant"
Region 302
/note="H -> Q (IN OTC DEFICIENCY; LATE ONSET)."
/region_name="Variant"
Region 302
/note="H -> L (IN OTC DEFICIENCY; FEMALE; LATE ONSET)."
/region_name="Variant"
Region 303
/note="C -> Y (IN OTC DEFICIENCY)."
/region_name="Variant"
Region 303
/note="C -> R (IN OTC DEFICIENCY; NEONATAL)."
/region_name="Variant"
Region 304
/note="L -> F (IN OTC DEFICIENCY)."
/region_name="Variant" "
It is beyond the scope of this problem, but one could generate tests of this correlation between conservation over a large phylogenetic distance and functional consequences of mutations in contemporary organisms.
4.10 DNA in nuclei is packaged into nucleosomes, in which the DNA is wrapped 1.8 time around a core of two each of the histones H2A, H2B, H3 and H4. The 146 nucleotide pairs wrapped around the core histones is followed by a spacer of variable length, but often about 60 nucleotide pairs, before the next nucleosome is encountered in the periodic array.
The bands have a periodicity of about 200 nucleotide pairs (200, 400, 600, ...), showing that the chromatin is protected from nuclease digestion in regular intervals of 200 nucleotide pairs. It was assumed that the nucleosomal cores were providing the protection, and indeed this was verified in numerous subsequent investigations. Thus the nucleosomes themselves are in a fairly regular array, occurring about once every 200 nucleotide pairs. The nuclease is cutting between the nucleosome cores, but it has not digested to completion. Some bands correspond to the DNA from single nucleosomes (200 nucleotide pairs), two nucleosomes (400 nucleotide pairs), and so forth. If the nucleosomes had been randomly distributed in the chromatin, then a very large number of differently sized DNA fragments would have been generated by the nuclease cleavage, and a heterogeneous population of DNA fragments would have smeared through the gel. The bands are thick because the spacer is fairly long (e.g. it is 60 nucleotide pairs in some nuclei) relative to the size of the nucleosomal core (146 nucleotide pairs). The nuclease can cut essentially anywhere in the spacer, so the band corresponding to, for example, mononucleosomes, has DNAs ranging from 146 nucleotide pairs to 206 nucleotide pairs.
4.11 The core contains H2A, H2B, H3 and H4 histones. Heterodimers form between H2A and H2B and between H3 and H4. In both heterodimers, the histone folds of the two proteins come together in an antiparallel manner. The histone fold is a cluster of 3 a-helices that make an elongated U; the heterodimers are crescent-shaped. Two H3-H4 dimers interact via a 4-helix bundle using helices from the ends of the histone folds; this forms the H32-H42 tetramer. H2A-H2B dimers interact with the H32-H42 tetramer via different 4-helix bundles.
4.12 The DNA in the minichromosomes is underwound, generating negative supercoils. If this were displayed as superhelical turns, they would be right-handed. However, this is equivalent to left-handed torroidal turns.
4.13 a) True
b) True
4.14 a) To calculate the packing ratio in the nucleosomal core, calculate the length of the 146 bp of DNA, at 0.34 nm/bp.
length of DNA = 146 bp ´ 0.34 nm/bp = 49.64 nm
The 1.65 turns of the DNA are very close packed, with a pitch of 2.39 nm. The length of the nucleosome, along the axis of the DNA superhelices, is covered almost completely by the DNA. Thus the pitch plus two radii of DNA is about the length of the nucleosome. The diameter of DNA is 1.9 nm.
length of nucleosome = pitch + 2r = 2.39 + = 2.39 nm + 1.9 nm
= 4.29 nm
packing ratio = = 11.57 or about 11.6
b) To calculate the packing ratio in the solenoid, calculate the length of the DNA. There are 3 nucleosomes per turn, each with a spacer. If you use 60 bp for the spacer length and 146 bp for the core, then there are 206 bp per nucleosome.
length of DNA = 6 ´ 206 bp ´ 0.34 nm/bp = 420.24 nm
The problem states that each turn of the solenoid translates 11 nm, which will be length into which this amount of DNA is compacted .
packing ratio= = 38.2
4.15 The midpoints of the two turns of the DNA are separated by 23.9 Å, which is the pitch of the superhelix. Each edge of the DNA is 1 DNA radius away from the midpoint. Thus the two edges are separated by
23.9 Å - 2 ´ = 4.9 Å