Regulatory Potential (RP) Scores
A research project of the Center for Comparative Genomics and Bioinformatics, Penn State University
NOTE: We have recently published ESPERR, an improved method for learning discriminative signals from genomic alignments. This method is now used for the computation of RP scores. The rest of this page is mainly of historical interest.
RP Scores are a computational tool to aid in the identification of putative regulatory sites of the human genome. Unlike tools based on searching for known transcription factor binding sites motifs, RP scores approach the problem from a comparative genomics perspective. These scores are computed from genome-wide alignments of the human with other organisms. In their current formulation, they exploit a mixture of conservation, composition and short-pattern structure information gathered from these alignments. We computed RP scores from 2-way alignments of human and mouse [1], and more recently from 3-way alignments of human, mouse, and rat [2]. We also investigated the effectiveness of strategies comprising RP scores, pure conservation scores and binding sites searches, experimentally validating some of the resulting predictions [3].
A brief description
The RP score of a generic aligned segment has the form:
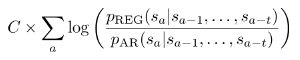
where C is a length-normalizing constant, a is an index ranging along alignment columns, and p_reg and p_ar are transition probabilities for two Markov models estimated, respectively, on a training set of alignments of known regulatory elements and a training set of alignments of ancestral repeats (the latter are taken as a model for neutral behavior). The s's are "states" in an alphabet S of alignment column symbols, and T represents the order of the Markov models. Through this formulation, the score weighs short patterns (length T+1) of symbols occurring in an alignment based on their being characteristic of known regulatory elements or neutral DNA.
The selected alphabet and order determine the mix of information underlying the score. For instance, for 2-way alignments, a 2-symbol alphabet S={Match, Else} and order T=0 would make for a score based on simple percent identity. A 3-symbol alphabet ={Match C or G, Match A or T, Else} and order T=0 would make for a score based on percent identity and CG content at matching positions. The same 3-symbol alphabet with order T=2 would make for a score based on percent identity, GC content at matching positions, and the frequency of length 3 patterns alternating GC matches, AT matches and else.
We use various statistical techniques (ranging from exploratory dimension reduction to hierarchical agglomeration algorithms and cross-validation schemes) to let the available training data guide our selection of alphabet and order. The 2-way RP score utilizes a 5-symbol alphabet and order 5 [1]. The 3-way RP score utilizes a 10-symbol alphabet and order 2 [2]. Parsimonious modeling, i.e. effective but small alphabets and orders, is particularly important given the still limited availability of training data from known regulatory elements. The curated collection of cis-regulatory elements employed in training is available here
Next Steps
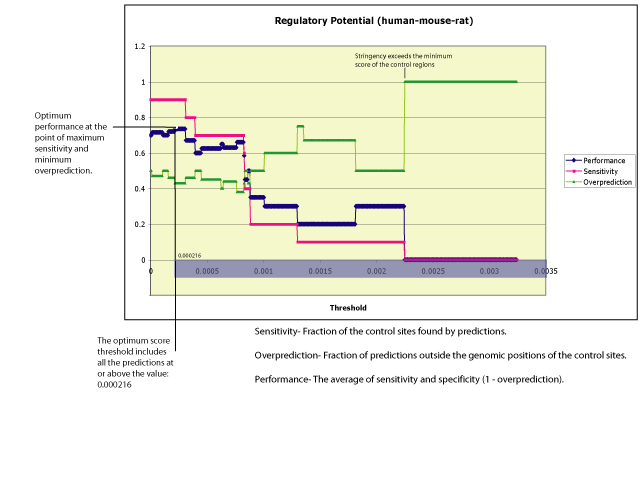
Calibration: In order to assess the performance of RP scores, and to compare their behavior to that of pure conservation scores, we are performing a calibration study on the region of the beta hemoglobin gene cluster. The beta hemoglobin gene cluster provides a control set of regulatory elements that have been well characterized experimentally. The performance of RP is evaluated by how efficiently it identifies genomic positions that coincide with the control segments within this region. An optimum threshold is determined as the minimum score that maximizes sensitivity while minimizing the over-prediction rate. The following figure summarizes some calibration results for human-mouse-rat RP scores.
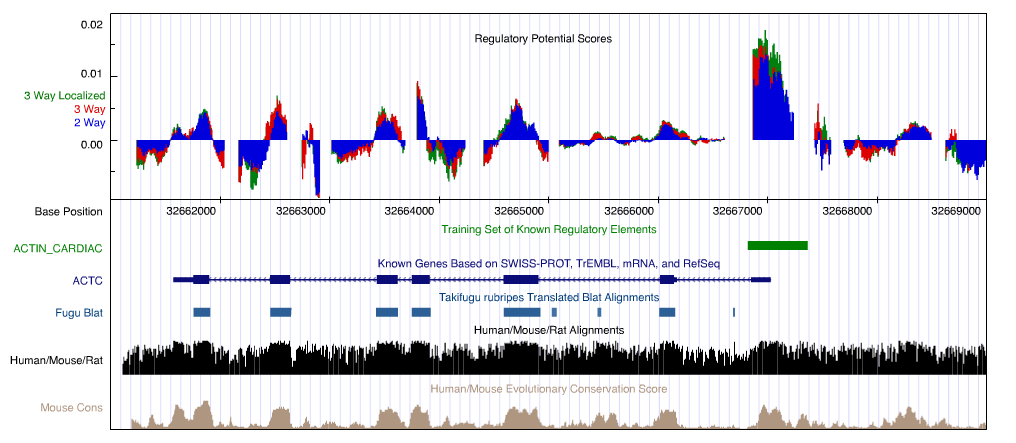
Localized scores: Following preliminary results in [2], we are investigating localized verisons of RP scores. These provide a "local background" for our comparison, with denominator transition probabilities estimated on regional ancestral repeats training alignments (although variation exists in their density, ancestral repeats are abundant throughout the human genome). The following figure shows human-mouse, human-mouse-rat and localized human-mouse-rat RP scores on 10kb surrounding one of our training regulatory elements (cardiac alpha actin, human chromosome 15).
Alphabet selection: On the methods side, we are working on various algorithms to further refine the alphabet selection procedure. These refinements are likely to be crucial when computing RP scores (and similarly designed scores) on alignments of multiple genomes.
References
[1] Distinguishing Regulatory DNA From Neutral Sites
Laura Elnitski, Ross Hardison, Jia Li, Shan Yang, Diana Kolbe, Pallavi Eswara, Michael J. O'Connor, Scott Schwartz, Webb Miller and Francesca Chiaromonte. Genome Research 13 (1): 64-72. PDF.
Abstract
We explore several computational approaches to analyzing interspecies genomic sequence alignments, aiming to distinguish regulatory regions from neutrally evolving DNA. Human-mouse genomic alignments were collected for three sets of human regions: (1) experimentally defined gene regulatory regions, (2) well- characterized exons (coding sequences, as a positive control) and (3) interspersed repeats thought to have inserted before the human-mouse split (a good model for neutrally-evolving DNA). Models that potentially could distinguish functional non-coding sequences from neutral DNA evaluated these three datasets, as well as bulk genome alignments, quantitatively. Our analyses show that discrimination based on frequencies of individual nucleotide pairs or gaps (i.e., of possible alignment columns) is only partially successful. In contrast, scoring procedures that include the alignment context, based on frequencies of short runs of alignment columns, dramatically improve separation between regulatory and neutral features. Such scoring functions should aid in the identification of putative regulatory regions throughout the human genome.
[2] Regulatory Potential Scores from Genome-Wide 3-way Alignments of Human, Mouse and Rat
Diana Kolbe, James Taylor, Laura Elnitski, Pallavi Eswara, Jia Li, Webb Miller, Ross Hardison and Francesca Chiaromonte. Genome Research 14: 700-707. PDF.
Abstract
We generalize the computation of the Regulatory Potential (RP) score from 2-way alignments of human and mouse to 3-way alignments of human, mouse and rat. This requires overcoming technical challenges which arise because the complexity of the models underlying the score increases exponentially with the number of species. Despite the close evolutionary proximity of rat to mouse, we find that adding the rat sequence increases our ability to predict genomic sites that regulate gene transcription. A variant of the RP scoring scheme that accounts for local variation in neutral mutational patterns further improves our predictions.
See also our poster presented at Rat Genomics and Models, Cold Spring Harbor Laboratory, 12/2003.
[3] Global Predictions and Tests of Erythroid Regulatory Regions
Ross Hardison, Francesca Chiaromonte, Diana Kolbe, Hao Wang, Hanna Petrykowska, Laura Elnitski, Shan Yang, Belinda Giardine, Yi Zhang, Cathy Riemer, Scott Schwartz, David Haussler, Krishna Roskin, Ryan Weber, Mark Diekhans, W. James Kent, Mitchell Weiss, John Welch and Webb Miller. Cold Spring Harbor Symposia in Quantitative Biology: The Genome of Homo Sapiens 68: 335-345. PDF.
Abstract
Whole-genome alignments of human, mouse and rat DNA have been evaluated to develop algorithms to predict gene regulatory regions by alignment quality (L-scores), patterns within the alignments (RP-scores) and clusters of conserved transcription factor binding sites obtained using our database of Genome Alignment and Annotation (GALA). We are testing the efficacy of these predictions by applying each algorithm to cohorts of genes that are co-expressed during the latter stages of erythroid differentiation. The cohorts are derived from microarray expression analysis of over 7000 mouse genes in two different erythroid cell models: (i) murine erythroleukemia (MEL) cells induced to produce markers of mature erythroblasts such as hemoglobin and (ii) Gata1-null proerythroblasts (G1E cells) transduced to express a hybrid GATA-1-ER protein that conditionally restores activity of the critical erythroid transcription factor GATA-1. Similar sets of genes are up- and down-regulated in the two cell lines upon induction or restoration of GATA-1; these comprise the cohorts being studied. We analyze sequence alignments of the genes in each cohort using the three programs to predict regulatory regions, and test the ability of these predicted regions to quantitatively increase or decrease expression after stable integration into MEL and G1E cells. Results from this approach should better define erythroid regulatory modules and improve the prediction programs. The combination of bioinformatic predictions and experimental tests in somatic cell developmental models serves as a paradigm for global analysis of regulation in any tissue.