CHAPTER
1
FUNDAMENTAL PROPERTIES OF GENES
Species share many traits in common from generation to generation. The bluebird nestlings in the box in my yard will look much like their parents when they are full-grown. The tomato plants that we set out will produce fruits that look, and hopefully taste, like those of their parents. Observable features of organisms, like color, size, and shape, comprise their phenotype. Adult male bluebirds share the phenotype of blue wings and a red breast.
A phenotype can be determined by inherited factors, by the environment, and often by both. For example, you are similar to your parents in many aspects of your appearance, your intelligence, and your susceptibility to some diseases, but you are not identical to them in all aspects of these traits. These three traits are clearly the product of both inherited and environmental factors. Considering appearance, I have crooked lower teeth and thinning gray hair, just like my father, but unlike me, neither of my parents has a scar on their knee from a childhood cut. The hair phenotype is inherited, whereas scars are from environmental influences. Quantitative studies show that intellectual capacity is about equally influenced by genetic and environmental factors. Susceptibility to diabetes is partially inherited, but a viral infection may trigger the autoimmune response at its core.
The genetic determinants of the inherited component of a phenotype are called genes. The set of genes that make up an organism is its genotype. In practice, we will consider only a small subset of the genes in an organism, which comprise a partial genotype. Likewise, an organism’s phenotype is all the traits it possesses, but we will only consider partial phenotypes, such as the blue wings of a bluebird or the color of the eyes of a fly.
This chapter will explore some of the basic characteristics of genes, and the experimental evidence for them. Some of the major points include the following.
§ Genes are the units of heredity
§ They are arranged in a linear fashion along chromosomes.
§ Recombination can occur both between and within genes.
§ Mutations in different genes required for a phenotype will complement each other in a diploid. This is the basis for genetic dissection of a pathway.
§ A gene is composed of a series of mutable sites that are also sites for recombination (now recognized as nucleotides).
§ One gene encodes one polypeptide.
§ The gene and the polypeptide are colinear.
§ Single amino acids are specified by a set of three adjacent mutable sites; this set is called a codon.
In considering experimental evidence for these points, some general genetic techniques as well as genetic techniques for bacteria and phage will be discussed.
Genes are mutable
We know that genes are mutable because they appear in different forms, called alleles. An allele that encodes a normal, functional product (found in nature or a standard laboratory stock) is called the wild type allele. Other alleles are altered in a way such that the encoded product differs in function from the wild type. This type of allele is mutated or mutant (adjective). The alteration in the gene is a mutation, and an organism showing the altered phenotype is a mutant (noun). Many mutated alleles encode a product that is nonfunctional or less functional than is the wild type, or normal, product; it is easier to break something than to improve it. A loss-of-function allele usually shows a recessive phenotype, which means that when it is present in the same cell as an allele that produces a different phenotype, the phenotype of the other allele is obtained. If no functional product is made, this loss-of-function allele is a null mutation; this can result from no expression or expression of a completely nonfunctional product. Other loss-of-function mutants make less than the normal amount of product, these are called hypomorphs. Another class of mutated allele encodes a product that provides an altered or new function. These gain-of-function mutations usually show a dominant phenotype; e.g. when the gain-of-function allele is in the same cell as a loss-of-function allele, the phenotype of the gain-of-function allele is observed. Another class of gain-of-function mutants makes more than the normal amount of product; these are called hypermorphs.
Within a population, the number of alleles at a given locus can vary considerably. Mutant alleles that cause a loss or detrimental change in the function of a gene are selected against, and they are rare in a wild population. In the laboratory, one can utilize growth conditions that select for certain mutants or that maintain mutants, so mutant organisms that would be rare or non-existent in the wild are encountered quite frequently in the laboratory. In many cases, however, alternate forms of genes, i.e. different alleles, have no particular effect on gene function. These variants can be found quite frequently in a population. One common examples of such genetically determined, apparently neutral variation is the ability of some persons to "roll" their tongue. In general, these common alleles are roughly equivalent in function to the wild type allele. Thus they are not providing a strong selective advantage or disadvantage. All the common alleles can be considered the wild type allele. Variant alleles that occur in greater than 5% of population are called polymorphisms. The term variant includes all alternative forms of a gene, whether they have an effect on function or not. The term mutant allele sometimes implies an altered function for the gene.
As will become clearer when we study the fine structure of genes, it is possible to change the structure of the gene (the nucleotide sequence in DNA) without changing the structure of the encoded polypeptide (the amino acid sequence). These silent substitutions also generate different alleles, but they can only be detected by examining the structure of the gene; the phenotypes of alleles that differ by silent substitutions are usually identical.
Another possibility is that a mutant allele not only causes a loss of function of the encoded protein, but this altered protein interferes with the activity of other proteins. One way this can happen is by the polypeptide product forming a complex with other polypeptides (e.g. in a heteromultimeric enzyme complex). Sometimes the mutant polypeptide will prevent formation of an active complex with the partner, even in the presence of wild-type polypeptide, thereby leading to a dominant negative phenotype. These are of considerable utility now in designing mutant genes and proteins to try to disrupt some cellular function. They are most commonly made in a vector that will drive a high level of expression of the mutant gene, and usually over-expression is needed to generate the dominant negative phenotype.
Genes are the units of heredity: Mendel's
Laws
First Law: Alleles segregate equally
The original experiments by Gregor Mendel involved phenotypic traits (physical, observable characteristics) controlled by single genes. The first one we'll consider is seed color, which can be yellow or green. The dominant allele, denoted Y, generates yellow peas in either the homozygous (YY) or heterozygous (Yy) state, whereas the recessive allele, denoted y, generates green peas only in the homozygous state (yy). (In plants and flies, the dominant allele is denoted by a capitalized abbreviation and the recessive allele is denoted by a lower case abbreviation.) In a cross between two parents, one homozygous for the dominant allele (YY) and the other homozygous for the recessive allele (yy), Mendel showed that the F1 progeny were all yellow, i.e. they had had the same phenotype as the parent with the dominant allele. The recessive allele was not contributing to the phenotype.
Had it been lost during the cross? No, when the F1 is crossed with itself, both parental phenotypes were seen in the F2 progeny. The effect of the recessive allele reappeared in the second cross, showing that it was still present in the F1 hybrids, but was having no effect. In the F2 progeny, the dominant phenotype (yellow) was observed in 75% of the progeny and the recessive (green) appeared in only 25% of the progeny.
Note that discrete phenotypes were obtained (yellow or green), not a continuum of phenotypes. The genes are behaving as units, not as some continuous function.
The results can be explained by hypothesizing that each parent has two copies of the gene (i.e., two alleles) that segregate equally, one per gamete. Since they are homozygous, each parent can form only type of gamete (Y or y, respectively). When the gametes join in the zygotes of the F1 generation, each individual receives one dominant allele and one recessive allele (Yy), and thus all of the F1 generation shows the dominant phenotype (e.g. yellow peas). This is the uniform phenotype observed for the F1 generation.
The two alleles did not alter one another when present together in the F1 generation, because when F1 is crossed with F1, the two parental phenotypes are obtained in the F2 generation.
The ratio of 3:1 dominant: recessive observed in the F2 is expected for the equal segregation of the alleles from the F1 (Y and y) and their random rejoining in the zygotes of the F2, producing the genotypes 1 YY, 2 Yy, and 1 yy. Again the genes are behaving as discrete units. These precise mathematical ratios (3:1 for phenotypes in this cross, or 1:2:1 for the genotype) provide the evidence that genes, units of heredity, are determining the phenotypes observed.
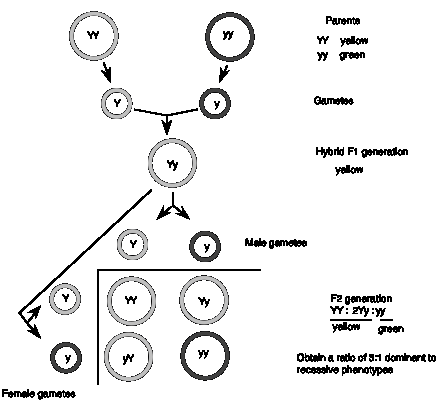
Figure 1.1. Mendel’s First Law: Equal segregation of alleles.
Not all loci show the property of complete dominance illustrated by the Y locus in peas. Sometimes partial dominance is observed, in which an intermediate phenotype seen in a heterozygote. An example is the pink color of snapdragons obtained when white and red are crossed. However, the parental phenotypes reappear in the F2 generation, showing that the alleles were not altered in the heterozygote. In this case, gene dosage is important in determining the phenotype; two wild-type alleles produce a red flower, but only one wild-type allele produces a pink flower. Sometimes co‑dominance is observed, in which both alleles contribute equally to the phenotype. An example is the ABO blood group locus. Heterozygotes have both the A and B form of the glycoprotein that is encoded by the different alleles of the gene.
Second Law: Different genes assort independently
Now that we have some understanding of the behavior of the different alleles of a single gene, let's consider how two different genes behave during a cross. Do they tend to stay together, or do they assort independently?
Mendel examined two different traits, seed color (as described in the previous section) and seed shape. Two alleles at the locus controlling seed shape were studied, the dominant round (R) and recessive wrinkled (r) alleles. Mendel crossed one parent that was homozygous for the dominant alleles of these two different genes (round yellow RRYY) with another parent that was homozygous for the recessive alleles of those two genes (wrinkled green rryy) (see Fig. 1.2).
Re-stating the basic question, do the alleles at each locus always stay together (i.e. round with yellow, wrinkled with green) or do they appear in new combinations in the progeny? As expected from the 1st law, the F1 generation shows a uniform round yellow phenotype, since one dominant and one recessive allele was inherited from the parents. When the F2 progeny are obtained by crossing the F1 generation, the parental phenotypes reappear (as expected from the first law), but two nonparental phenotypes also appear that differ from the parents: wrinkled yellow and round green!
The results can be explained by the alleles of each different gene assorting into gametes independently. For example, in the gametes from the F1 generation, R can assort with Y or y, and r can assort with Y or y, so that four types of gametes form: RY, Ry, rY, and ry. These can rejoin randomly with other gametes from the F1 generation, producing the results in the grid shown in Fig. 1.2. The alternative, that R always assorted with Y, etc. was not observed.
Again, the genes are behaving as units, and the gene for one trait (e.g. color) does not affect a gene for another trait (e.g. shape). Further breeding shows that many nonparental genotypes are present, some of which give a parental phenotype (e.g. RrYy).
These results are obtained for genes that are not linked on chromosomes. Linkage can lead to deviations from these expected ratios in a mating, and this can be used to map the locations of genes on chromosomes, as discussed in the next section.
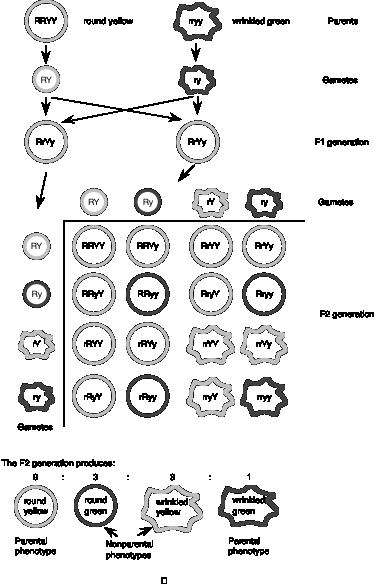
Figure 1.2. Mendel’s Second Law: Independent assortment of different genes.
Genes are on chromosomes
In 1902, Sutton and Boveri independently realized that the behavior of genes in Mendelian crosses mimics the movement of chromosomes during meiosis and fertilization. They surmised that the two alleles of each gene correlated with the homologous pair of chromosomes. The equal segregation of alleles could be explained by the separation of homologous chromosomes at anaphase I of meiosis. As diagrammed in Fig. 1.3, the chromosome with the R allele would go to a different cell than its homolog with the r allele at the end of meiosis I, and likewise for the Y and y alleles. The rejoining of alleles corresponded to the joining of chromosomes, one from each parent, at fertilization. The independent assortment of different genes mimics the independent separation of homologs of different chromosomes in meiosis. For instance, the paternal copy of chromosome 1 may assort with the maternal copy of chromosome 21 in formation of a gamete. Figure 1.3 shows the dark blue chromosome with the R allele assorting with the light red chromosome with the y allele, but it is equally likely that it will assort with the dark red chromosome with the Y allele. As shown in Fig. 1.4, the completion of meiosis results in 4 germ cells for each cell that entered meiosis. All the combinations of alleles of different genes diagrammed in Fig. 1.2 can be formed in this process.
This correlation of the behavior of alleles in matings and the movement of chromosomes during meiosis and fertilization produced the chromosomal theory of inheritance. One could think of the alleles discerned in genetic crosses as being located at the same locus on the different homologs of a chromosome.
Legend for Figure 1.3. [NEXT PAGE] Movement of chromosomes during meiosis I, the first divisional process of meiosis. The chromosomes are drawn starting after the synthesis of a copy of each homologous chromosome, so there are two copies of each homolog of a chromosome pair. The two DNA duplexes for each homolog are joined at a single centromere. Meiosis is the process of segregating these four copies of each chromosome (4 alleles for each gene) into four germ cells with one copy of each chromosome. In this diagram, two different chromosome pairs are displayed with each homolog colored a different shade (dark or light red for the shorter chromosome, dark or light blue for the longer chromosome). Each line is a duplex DNA molecule. The R locus is on the longer blue chromosome, with distinctive alleles for each homolog, and the Y locus is on the shorter red chromosome, again with distinctive alleles for each homolog. Meiosis begins with the leptotene, when the chromosomes become visible as long filaments. The two homologous chromosomes undergo synapsis during zygotene, in which they align along their lengths. The chromosomes become shorter and thicker during pachytene, and crossovers between chromatids of the two different homologs form. The chromosomes start to pull apart in diplotene, at which point the crossovers in chiasmata are visible. The chromosomes shorten further during diakinesis. During metaphase, the chromosomes align along the equatorial plane of the cell, i.e. the plane in which cell division will occur. The nuclear membrane is disassembled at this point. The members of a homologous pair move to opposite poles of the cell during anaphase. This is the cytological even that accounts for the equal segregation of alleles. Note that the centromeres do not separate during anaphase I, and the two sister chromatids stay together. The crossovers are also resolved at this stage. In some organisms, the nuclear membrane reforms during a telophase of meiosis I, followed by cell division and an interphase I.
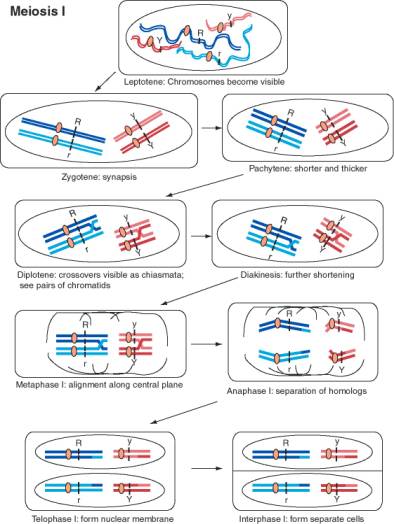
Figure 1.3. Movement of chromosomes during meiosis I.
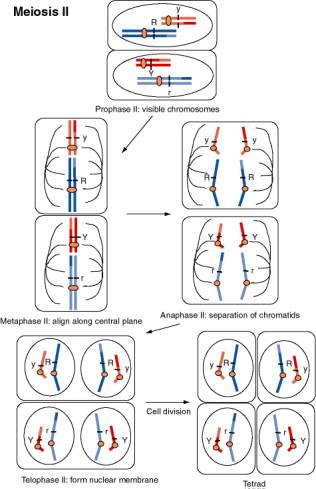
Figure 1.4. Movement of chromosomes during meiosis II, the second divisional process of meiosis. The chromosomes, each with two sister chromatids linked at the centromere, contract and become visible during prophase II. The nuclear membrane disassembles and chromosomes align along the equatorial plane during metaphase II. The centromeres divide and the chromosomes separate during anaphase II. The nuclear membrane reforms during telophase II, and after cell division, a tetrad with one of each chromosome is produced. If the dark blue chromosome had assorted with the dark red chromosome during anaphase I, the resulting spores would be R Y and r y.
Linked genes lie along chromosomes in a
linear array
The proponents of the chromosome theory of heredity realized that that the number of genes would probably greatly exceed the number of chromosomes. However, many early genetic studies showed independent assortment between genes with no evidence of linkage. This led to a proposal that a chromosome broke down during meiosis into smaller parts consisting only of individual genes, but such disassembly of chromosomes during meiosis was never observed. Evidence for linkage did eventually come from a demonstration of the absence of independent assortment between different genes. In complementary work, McClintock and Creighton demonstrated an association between different genes and a particular chromosome in 1931.
The behavior of two genes carried on the same chromosome may deviate from the predictions of Mendel's 2nd law. The proportion of parental genotypes in the F2 may be greater than expected because of a reduction in nonparental genotypes. This propensity of some characters to remain associated instead of assorting independently is called linkage. When deduced from studies of a population, it is called linkage disequilibrium.
Fig. 1.5. illustrates a cross that shows linkage.
(1) An F1 heterozygote (AaBb) is made by crossing a homozygous dominant parent (AABB) with a homozygous recessive parent (aabb). A backcross is then made between the F1 heterozygote (AaBb) and a recessive homozygote (aabb), so that the alleles of the recessive parent make no contribution to the phenotype of the progeny. (This is a fairly common cross in genetics, since the genotype of an individual can be ascertained by crossing with such an individual, homozygous recessive at both loci.)
(2) As shown in part A of Fig. 1.5, if there is no linkage, one expects 50% parental phenotypes (from genotypes AaBb and aabb) and 50% nonparental phenotypes (from genotypes Aabb and aaBb). This fits with the expectations of Mendel's law of independent assortment of different genes for this backcross. (Sometimes the nonparental phenotypes are called "recombinant" but that confuses this reassortment with events that involve crossovers in the DNA.)
(3) If the two genes are linked and there is no recombination between them, then all progeny will have a parental phenotype. In particular, if genes A and B are linked, then the backcross AB/ab x ab/ab yields AB/ab progeny 50% of the time and ab/ab progeny 50% of the time, in the absence of recombination. [In this notation, the alleles to the left of the slash (/) are linked on one chromosome and the alleles to the right of the slash are linked on the homologous chromosome.] Thus only the parental phenotypes are found in the progeny of this cross (i.e. the progeny will show either the dominant characters at each locus or the recessive characters at each locus). Another way of looking at this is that, in the absence of recombination between the homologous chromosomes, all the progeny of this cross will be one of the first two types shown in panel B of Fig. 1.5.
Note that the dominant alleles can be in the opposite phase, with the dominant A allele linked to the recessive b allele. For instance, the F1 heterozygote could be formed by a cross between the parents Ab/Ab and aB/aB to generate Ab/aB. In this case, the backcross Ab/aB x ab/ab will still generate only progeny with parental phenotypes but a new, nonparental genotype (i.e. Ab/ab and aB/ab; these look like the parents Ab/Ab and aB/aB). The phase with both dominant alleles on the same chromosome is called the "coupling conformation”, whereas the opposite phase is called the "repulsing conformation."
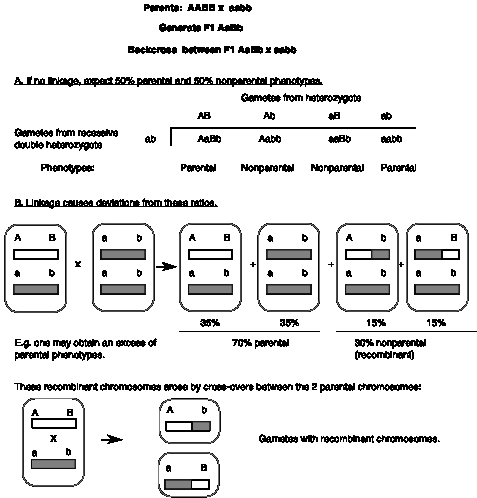
Figure 1.5. Linkage and recombination between genes on the same chromosome.
(4) But in most cases, recombination can occur between linked genes. In part B of Fig. 1.5, there is an increase in parental types (from the 50% expected for unlinked genes to the observed 70%) and a decrease in nonparental types (30%), showing that allele A tends to stay with allele B, in contrast to the prediction of the 2nd law. Thus these genes are not assorting independently, and one concludes there is linkage between genes A and B.
The frequency of parental types is not as high as expected for linkage without recombination (which would have been 100%, as discussed above). Indeed, the nonparental types in this experiment result from a physical crossover (breaking and rejoining) between the two homologous chromosomes during meiosis in the AB/ab parent. This is a recombination event in the DNA.
(5) We conclude that genes A and B are linked, and have a recombination frequency of 30%.
map distance = x 100
1 map unit = 1 centiMorgan = 1% recombination
1 centiMorgan = 1 cM = about 1 Mb for human chromosomes
Question 1.1.
In their genetic studies of the fruitfly Drosophila melanogaster, Thomas Hunt Morgan and his co-workers found many examples of genes that associated together in groups. One example is the gene for purple eye color (the mutant allele is abbreviated pr) that is recessive to the allele for normal red eyes (pr+) and the gene for vestigial, or shortened, wings (the mutant allele is abbreviated vg) that is recessive to the normal allele for long wings (vg+). When a homozygous purple vestigial fly is crossed to a homozygous red-eyed long-winged fly, the heterozygous F1 generation shows a normal phenotype. When male heterozygotes are backcrossed to females that are homozygous purple vestigial (i.e. homozygous recessive at both loci), only two phenotypes appear in the progeny: the homozygous recessive purple vestigial flies and the normal flies.
a) What are the predictions of the backcross if the two genes are not linked?
b) What do the results of the backcross tell you?
c) If the heterozygotes F1 in the backcross are female, then purple long-winged and red-eyed vestigial flies appear in the progeny. The combined frequency of these recombinant types is 15.2 %. What does this tell you about the arrangement of the genes?
Question 1.5 provides some practice in calculating recombination frequencies.
Individual map distances are (roughly) additive.
A‑‑10‑‑B‑5‑C
‑‑‑-‑‑‑-‑15‑‑‑‑
The recombination distances are not strictly additive if multiple crossovers can occur (see questions 1.6 and 1.7.)
Recombination between linked genes occurs by the process of crossing over between chromosomes, at chiasma during meiosis. The mechanism of recombination is considered in Chapter 8.
Genetic dissection by complementation
Genes are the hereditary units that when altered change a phenotype; genes are classically defined by their effects on phenotype. But in many cases more than one gene affects a phenotype. Metabolic pathways, such as synthesis of DNA, repair of DNA, synthesis of leucine, or breakdown of starch occur in multiple steps catalyzed by enzymes. Each subunit of each enzyme is encoded in a gene, and all those genes are needed for the efficient running of the pathway. Multiple genes also determine complex traits, such as susceptibility to substance abuse, diabetes, and other diseases, and probably less pressing concerns, such as retaining a healthy head of hair after you are 40.
Many pathways have been elucidated by finding many mutants that are defective in that process, hopefully enough to sample every gene in the organism (saturation mutagenesis), and grouping them according to the gene that is mutated. All the mutations in the same gene fall into the same complementation group. Two mutants complement each other if they restore the normal phenotype when together in a diploid. This occurs when the mutants have mutations in different genes. If one is examining mutants with a similar phenotype (e.g. inability to grow on leucine or inability to make DNA), then tests of all pairwise combinations of the mutants will place them into complementation group, which complement between groups but not within groups. The complementation groups then define the genes in the process under study. This is a powerful method of genetic dissection of a pathway. We will encounter it over and over in this textbook. In this section, we will look at complementation in detail, and contrast it with recombination.
Complementation
Dominance observed in heterozygotes reflects the ability of wild-type alleles to complement loss-of-function alleles. You know that a dominant allele will determine the phenotype of a heterozygote composed of a dominant and a recessive allele. Often, recessive alleles are loss-of-function mutations, whereas the dominant allele is the wild type, encoding a functional enzyme. Using the example that led to Mendel's First Law, a cross between YY (yellow) peas and yy (green) peas yielded yellow peas in the F1 heterozygote (Yy). In this case the chromosome carrying the Y allele encodes the enzymatic function missing in the product of the recessive y allele, and the pathway for pigment biosynthesis continues on to make a yellow product. Thus you could say that the dominant Y allele complements the recessive y allele - it provides the missing function.
We can continue the analogy to the classic cross for Mendel's Second Law. Let's look at the same genes, but a different arrangement of alleles. Consider a cross between round green (RRyy) and wrinkled yellow (rrYY) peas; in this case each parent is providing a dominant allele of one gene and a recessive allele of the other. The F1 heterozygote is round yellow (RrYy), i.e., the phenotypes of the dominant alleles are seen. But you could also describe this situation as the chromosomes from rrYY peas complementing the deficiency in the RRyy chromosomes, and vice versa. In particular, the Y allele from the rrYY parent provides the function missing in the y allele from the RRyy parent, and the R allele from the RRyy parent provides the function missing in the r allele from the rrYY parent. If the phenotype you are looking for is a round yellow pea, you could conclude that mutants in the R-gene complement mutants in the Y-gene. Since in a heterozygote, the functional allele will provide the activity missing in the mutant allele (if the mutation is a loss-of-function), one could say that dominant alleles complement recessive alleles. Thus dominant alleles determine the phenotype in a heterozygote with both dominant and recessive alleles.
A general definition of complementation is the ability of two mutants in combination to restore a normal phenotype. Consider two genes, A with wild-type allele A1 and loss-of-function allele A2, and B with wild-type allele B1 and loss-of-function allele B2. A cross between two mutant organisms, one homozygous for mutations in A and the other homozygous for mutations in B, produces wild-type progeny:
A2A2 B1B1 ´ A1A1 B2B2 parents
¯
A2A1 B1B2 F1 progeny
Note that one wild type allele is present for each locus, A1 for gene A and B1 for gene B. Thus the F1 progeny, what was missing in each mutant parent is restored in the heterozygous progeny. We say that the two mutants complement each other.
Complementation distinguishes between mutations in the same gene or in different genes
The ability of complementation analysis to determine whether mutations are in the same or different genes is the basis for genetic dissection. In this process, one finds the genes whose products are required in a pathway. In the examples from peas used above, the metabolic pathway to yellow pigments is distinctly different from the pathway to round peas, which is the starch biosynthesis pathway. Complementation analysis is useful in dissecting the steps in a pathway, starting with many mutants that generate the same phenotype. This is a more conventional example of complementation.
Many fungi can propagate as haploids but can also mate to form diploids prior to sporulation. Thus one can screen for mutants in haploids and obtain recessive mutants, and then test their behavior in combination with other mutants in the diploid state. Let's say that a haploid strain of a fungus was mutagenized and screened for arginine auxotrophs, i.e. mutants that require arginine to grow. Six of the mutants were mated to form all the possible diploid combinations, and tested for the ability of the diploids to grow in the absence of arginine (prototrophy). The results are tabulated below, with a + designating growth in the absence of arginine, and a - designating no growth.
Table 1.1. Growth of the diploids in the absence of arginine
Mutant number
|
Mutant number |
1 |
2 |
3 |
4 |
5 |
6 |
|
1 |
- |
+ |
+ |
- |
+ |
+ |
|
2 |
|
- |
- |
+ |
+ |
+ |
|
3 |
|
|
- |
+ |
+ |
+ |
|
4 |
|
|
|
- |
+ |
+ |
|
5 |
|
|
|
|
- |
+ |
|
6 |
|
|
|
|
|
- |
As you would expect, when mutant 1 is mated with itself, the resulting diploid is still an auxotroph; this is the same as being homozygous for the defective allele of a gene. But when mutant 1 is mated with mutant 2 (so their chromosomes are combined), the resulting diploid has prototrophy restored, i.e. it can make its own arginine. This is true for all the progeny. We conclude that mutant 1 will complement mutant 2. If we say that mutant 1 has a mutation in gene 1 of the pathway for arginine biosynthesis, and mutant 2 has a mutation in gene 2 of this pathway, then the diagram in Fig. 1.6 describes the situation in the haploids and the diploid. (Note that if the organism has more than one chromosome, then genes 1 and 2 need not be on the same chromosome.) Since the enzymes encoded by genes 1 and 2 are needed for arginine biosynthesis, neither mutant in the haploid state can make arginine. But when these chromosomes are combined in the diploid state, the chromosome from mutant 1 will provide a normal product of gene 2, and the chromosome from mutant 2 will provide a normal product of gene 1. Since each provides what is missing in the other, they complement. Just like Jack Spratt and his wife. Mutant 1 will also complement mutant 3, and one concludes that these strains are carrying mutations in different genes required for arginine biosynthesis.
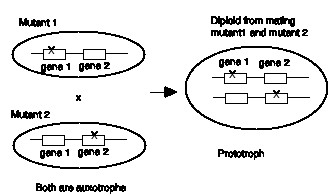
Figure 1.6. Complementation between two haploid mutants when combined in a diploid.
In contrast, the diploid resulting from mating mutant 1 with mutant 4 is still an auxotroph; it will not grow in the absence of arginine. Assuming that both these mutants are recessive (i.e. contain loss-of-function alleles), then we conclude that the mutations are in the same gene (gene 1 in the above diagram). We place these mutants in the same complementation group. Likewise, mutants 2 and 3 fail to complement, and they are in the same complementation group. Thus mutant 2 and mutant 3 are carrying different mutant alleles of the same gene (gene 2).
Mutant 5 will complement all the other mutants, so it is in a different gene, and the same is true for mutant 6. Thus this mutation and complementation analysis shows that this fungus has at least 4 genes involved in arginine biosynthesis: gene 1 (defined by mutants alleles in strains 1 and 4), gene 2 (defined by mutants alleles in strains 2 and 3), and two other genes, one mutated in strain 5 and the other mutated in strain 6.
Genetic dissection by complementation is very powerful. An investigator can start with a large number of mutants, all of which have the same phenotype, and then group them into sets of mutant alleles of different genes. Groups of mutations that do not complement each other constitute a complementation group, which is equivalent to a gene. Each mutation in a given complementation group is a mutant allele of the gene. The product of each gene, whether a polypeptide or RNA, is needed for the cellular function that, when altered, generates the phenotype that was the basis for the initial screen. The number of different complementation groups, or genes, gives an approximation of the number of polypeptides or RNA molecules utilized in generating the cellular function.
Question 1.2.
Consider the following complementation analysis. Five mutations in a biosynthetic pathway (producing auxotrophs in a haploid state) were placed pairwise in a cell in trans (diploid analysis). The diploid cells were then assayed for reconstitution of the biosynthetic pathway; complementing mutations were able to grow in the absence of the end product of the pathway (i.e. they now had a functional biosynthetic pathway). A + indicates a complementing pair of mutations; a - means that the two mutations did not complement.
Mutation number
1 2 3 4 5
1 - + - + -
2 - + + +
3 - + -
4 - +
5 -
a) Which mutations are in the same complementation group (representing mutant alleles of the same gene)?
b) What is the minimal number of enzymatic steps in the biosynthetic pathway?
Recombination
Note that all the diploid progeny fungi from the mating of mutant strains 1 and 2 have the ability to grow on arginine, and this complementation does not require any change in the two chromosomes (Fig. 1.6.). The only thing that is happening is that the functional alleles of each gene are providing active enzymes. If genes 1 and 2 are on the same chromosome, at a low frequency, recombinations between the two chromosomes in the diploid can lead to crossovers, resulting in one chromosome with wild-type alleles of each gene and another chromosome with the mutant alleles of each gene (Fig. 1.7). This can be observed in fungi by inducing sporulation of the diploid. Each spore is haploid, and the vast majority will carry one of the two parental chromosomes, and hence be defective in either gene 1 or gene 2. But wild type recombinants can be observed at a low frequency; these will be prototrophs. The double-mutant recombinants will be auxotrophs, of course, but these can be distinguished from the parental single mutants by the inability of the double mutants to complement either mutant strain 1 or strain 2.
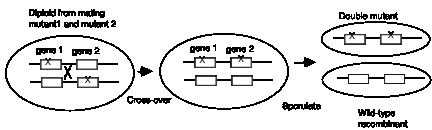
Figure 1.7. Recombination between homologous chromosomes in a diploid
Note that this recombination is a physical alteration in the chromosomes. The frequency of its occurrence is directly proportional to the distance the genes are apart, which is the basis for mapping genes by their recombination distances. Recombination occurs in a small fraction of the progeny, whereas all the progeny of a complementing diploid have the previously lost function restored.
Genetic methods in microorganisms
The genetic systems found in bacteria and fungi are particularly powerful. The small size of the genome (all the genetic material in an organism), the ability to examine both haploid and diploid forms, and the ease of large-scale screens have made them the method of choice for many investigations. Some of the key features will be summarized in this section.
Microorganisms such as bacteria and fungi have several advantages for genetic analysis. They have a haploid genome, thus an investigator can detect recessive phenotypes easily and rapidly. In the haploid (1N) state, only one allele is present for each gene, and thus its phenotype is the one observed in the organism.
Bacteria can carry plasmids and can be infected with viruses, each of which are capable of carrying copies of bacterial genes. Thus bacteria can be partially diploid, or merodiploid, for some genes. This allows one to test whether alleles are dominant or recessive.
Bacteria are capable of sexual transfer of genetic information, during which time homologous chromosomes can recombine. Thus one can use recombination frequency to map genes, analogous to the process in diploid sexual organisms. Indeed, a high frequency of recombination was essential in investigations of the fine structure of genes.
Bacteria grow, or increase in cell number, very rapidly. Generation times can be as short as 20 to 30 minutes. Thus many generations can be examined in a short time.
An investigator can obtain large quantities of mutant organisms for biochemical fractionation.
Bacterial genomes are small, ranging from about 0.580 (Mycoplasma genitalium) to 4.639 million base pairs (E. coli), with about 500 to 4300 genes, respectively. Compared to organisms with genomes 100 to 1000 times larger, this makes it easier to saturate the genome with mutations that disrupt some physiological process. Also, the smaller genome size, plus the availability of transducing phage, made it possible to isolate bacterial genes for intensive study.
Genomes of several bacteria are now completely sequenced, so all the genes, and their DNA sequences are known.
Yeast, such as Saccharomyces cerevisiae, are eukaryotic microorganisms that have both a haploid and a diploid phase to their life cycle, and thus have these same advantages as bacteria. Although its genome is larger (12 million base pairs), and it has 16 chromosomes, it is a powerful model organism for genetic and biochemical investigation of many aspects of molecular and cell biology. The genome of Saccharomyces cerevisiae is completely sequenced, revealing about 6100 genes.
One can use mutagens to increase the number of mutations, e.g. to modify bases, intercalate, etc. Specific mutagens will be considered in Part Two of the course.
Replica plating allows one to test colonies under different growth conditions. This is illustrated in Fig. 1.8 for finding mutant with new growth factor requirements. Replica plating can be used to compare growth of cells on complete medium, minimal medium, and minimal medium supplemented with a specific growth factor, e.g. an amino acid like Arg (the abbreviation for arginine). Cells that grow on minimal medium supplemented with Arg, but not on minimal medium are Arg auxotrophs. The word auxotroph means "increased growth requirements". These are cells that require some additional nutrient (growth factor) to grow. Prototrophs (usually the wild type cells) do not have the need for the additional factor and grow on minimal medium. In this case, they still make their own Arg.
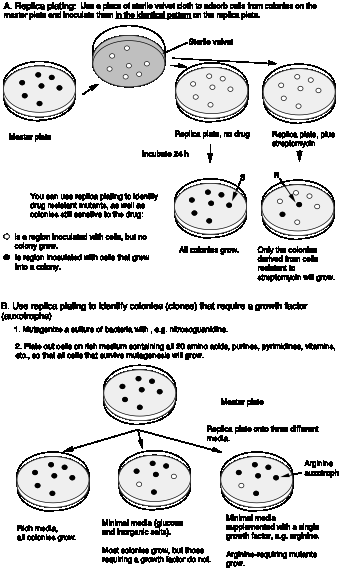
Figure 1.8. Replica plating of microorganisms. Panel A shows the technique of replica plating to screen for drug sensitivity. Panel B illustrates its application to finding mutants with growth factor requirements.
Sometimes the trait one is selecting for is lethal to the organism. In this situation, one can screen for conditional mutants. These are mutants that grow under one condition and not under another condition. Conditional mutants that grow at a low temperature but not at a high temperature are are called "temperature sensitive" or ts mutants. Conditional mutants are not necessarily associated with lethality. The dark ear tips, nose and feet of a Siamese cat are the phenotype of a temperature sensitive mutation in the c locus (determining fur color). The enzyme encoded is not functional at higher temperatures, but is functional at lower temperatures, such as the extremities of the cat. Hence the fur on these parts of the Siamese cat’s body is pigmented.
Conjugation in bacteria
The ability to plate out large numbers of haploid bacteria or fungi on a Petri dish, and to examine a single colony (or clone) under a variety of conditions (with an without a growth factor, with and without a drug, or at high and low temperature), makes it relatively easy to screen through many individuals to find mutants with a particular phenotype. However, in order to carry out a complementation analysis, one needs to be able to combine the two haploid mutants in one cell. Many fungi, such as yeast, do this thorough a natural meiotic sporulation and mating process. Fig. 1.6 illustrates the use of fungal matings in complementation.
Bacteria can also, although not by meiosis and fertilization, and only a part of the genome of one bacterium is transferred to another. The sexual transfer of information in E. coli uses plasmids called F (fertility) factors or Hfr strains. Male E. coli cells have a large plasmid, the F or fertility factor. A plasmid is a circular, extrachromosomal DNA molecule that is not essential to the bacterium. The F plasmid can transfer DNA from the male cell to an F- or female cell, in a process called conjugation (Fig. 1.10). The male and female cells are brought close together by attachments at pili, the cells join and DNA is synthesized from the F plasmid and transferred into the recipient cells. This converts the female cell to a male cell, in response to conjugation via pili.
In some strains of E. coli the F factor is integrated. In this case, the DNA transfer starts in F region of the chromosome, but it also transfers adjacent chromosomal DNA. These are called hfr strains, for their high frequency of recombination. The transferred DNA recombines with the DNA in the recipient cell.
Some F-related plasmids are a hybrid of F DNA and host bacterial DNA. These F’ plasmids appear to be derived from F factors but they have replaced some of the F DNA with bacterial DNA. Thus they are convenient carriers of parts of the E. coli genome.
This conjugal transfer can be used to create partial diploids, also called merodiploids, in E. coli. For some time after conjugation, a portion of two different copies of the chromosome is present in the same cells. Another method is to introduce F’ factors, carrying bacterial DNA, into another strain. These are two ways to do complementation analysis in E. coli.
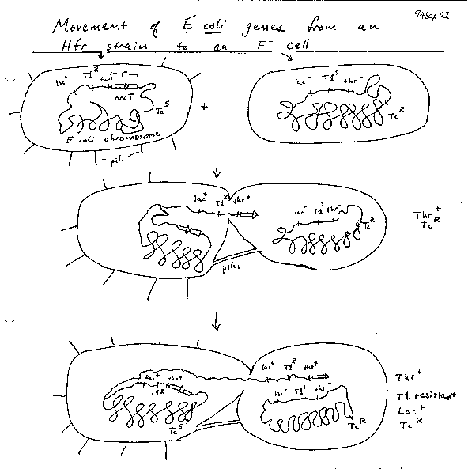
Figure 1.10. F-factor mediated conjugal transfer of DNA in bacteria.
Gene mapping by conjugal transfer
Conjugal transfer can also be used for genetic mapping. By using many different hfr strains, each with the F factor integrated at a different part of the E. coli chromosome, the positions of many genes were mapped. These studies showed that the genetic map of the E. coli chromosome is circular.
During conjugal transfer, genes closer to the site of F integration are transferred first. By disrupting the mating at different times, one can determine which genes are closer to the integration site. Thus on the E. coli chromosome, genes are mapped in terms of minutes (i.e., the time it takes to transfer to recipient).
For example, for an hfr strain with the F factor integrated at 0 min on the E. coli map, conjugal transfer to a female recipient would transfer
leuACBD at 1.7 min
pyrH at 4.6 min
proAB at 5.9 min
bioABFCD at 17.5 min.
Use of hfr strains with different sites of integration (initiation of transfer) allows the entire circular genome to be mapped (Fig. 1.11). 0/100 is thrABC.

Figure 1.11.
Circular genetic map of E. coli.
Bacteriophage
Bacteriophage are viruses that infect bacteria. Because of their very large number of progeny and ability to recombine in mixed infections (more than one strain of bacteria in an infection), they have been used extensively in high-resolution definition of genes. Much of what we know about genetic fine structure, prior to the advent of techniques for isolating and sequencing genes, derive form studies in bacteriophage.
Bacteriophage have been a powerful model genetic system, because they have small genomes, have a short life cycle, and produce many progeny from an infected cell. They provide a very efficient means for transfer of DNA into or between cells. The large number of progeny makes it possible to measure very rare recombination events.
Lytic bacteriophage form plaques on lawns of bacteria; these are regions of clearing where infected bacteria have lysed. Early work focused on mutants with different plaque morphology, e.g. T2 r, which shows rapid lysis and generates larger plaques, or on mutants with different host range, e.g. T2 h, which will kill both host strains B and B/2.
A cis-trans complementation test defines a
cistron, which is a gene
Seymour Benzer used the r II locus of phage T4 to define genes by virtue of their behavior in a complementation test, and also to provide fundamental insight into the structure of genes (in particular, the arrangement of mutable sites - see the next section). The difference in plaque morphology between r and r+ phage is easy to see (large versus small, respectively), and Benzer isolated many r mutants of phage T4. The wild type, but not any rII mutants, will grow on E. coli strain K12(l), whereas both wild type and mutant phage grow equally well on E. coli strain B. Thus the wild phenotype is readily detected by its ability to grow in strain K12 (l).
If E. coli strain K12 (l) is co-infected with 2 phage carrying mutations at different positions in rIIA, you get no multiplication of the phage (except the extremely rare wild type recombinants, which occur at about 1 in 106 progeny). In the diagram below, each line represents the chromosome from one of the parental phage.
phage 1 _|__x______|________|_
phage 2 _|_______x_|________|_
Likewise, if the two phage in the co-infection carry mutations at different positions in rIIB, you get no multiplication of the phage (except the extremely rare wild type recombinants, about 1 in 106).
rIIA rIIB
phage 3 _|_________|_x______|_
phage 4 _|_________|______x_|_
However, if one of the co-infecting phage carries a mutation in rIIA and the other a mutation in rIIB, then you see multiplication of the phage, forming a very large number of plaques on E. coli strain K12 (l).
rIIA rIIB
phage 1 _|__x______|________|_ Provides wt rIIB protein
phage 4 _|_________|______x_|_ Provides wt rIIA protein
Together these two phage provide all the phage functions - they complement each other. This is a positive complementation test. The first two examples show no complementation, and we place them in the same complementation group. Mutants that do not complement are placed in the same complementation group; they are different mutant alleles of the same gene. Benzer showed that there were two complementation groups (and therefore two genes) at the r II locus, which he called A and B.
Question 1.3. In the mixed infection with phage 1 and phage 4, you also obtain the rare wild type recombinants, but there are more recombinants than are seen in the co-infections with different mutant alleles. Why?
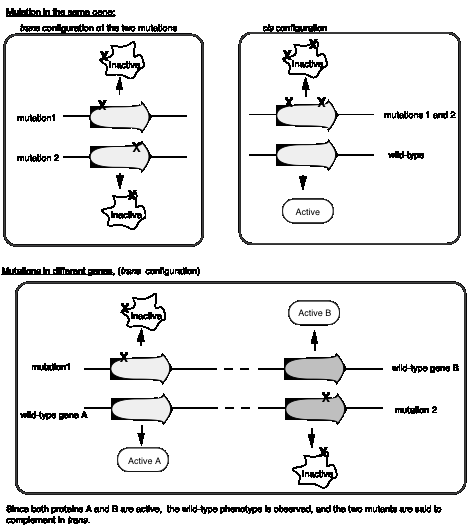
Benzer’s experiments analyzing the rII locus of bacteriophage T4 formalized the idea of a cis‑trans complementation test to define a cistron, which is an operational definition of a gene. First, let’s define cis and trans when used to refer to genes. In the cis configuration, both mutations are on the same chromosome. In the trans configuration, each mutation is on a different chromosome
Mutations in the same gene will not complement in trans, whereas mutations in different genes will complement in trans (Fig. 1.12). In the cis configuration, the other chromosome is wild type, and wild‑type will complement any recessive mutation.
The complementation group corresponds to a genetic entity we call a cistron, it is equivalent to a gene.
This test requires a diploid situation. This can be a natural diploid (2 copies of each chromosome) or a partial, or merodiploid, e.g. by conjugating with a cell carrying an F' factor. Some bacteriophage carry pieces of the host chromosome; these are called transducing phage. Infection of E. coli with a transducing phage carrying a mutation in a host gene is another way to create a merodiploid in the laboratory for complementation analysis.
Figure
1.12. The complementation test defines the
cistron and distinguishes between two genes.
Recombination within genes allows
construction of a linear map of mutable sites that constitute a gene
Once the recombination analysis made it clear that chromosomes were linear arrays of genes, these were thought of as "string of pearls" with the genes, or "pearls," separated by some non‑genetic material (Fig. 1.13). This putative non-genetic material was thought to be the site of recombination, whereas the genes, the units of inheritance, were thought to be resistant to recombination. However, by examining the large number of progeny of bacteriophage infections, one can demonstrate that recombination can occur within a gene. This supports the second model shown in Fig. 1.13. Because of the tight packing of coding regions in phage genomes, recombination almost always occurs within genes in bacteriophage, but in genomes with considerable non-coding regions between genes, recombination can occur between genes as well.

Figure 1.13. Models for
genes as either discrete mutable units separate by non-genetic material (top)
or as part of a continuous genetic material (bottom).
The tests between these two models required screening for genetic markers (mutations) that are very close to each other. When two markers are very close to each other, the recombination frequency is extremely low, so enough progeny have to be examined to resolve map distances of, say 0.02 centiMorgans = 0.02 map units = 0.02 % recombinants. This means that 2 out of 10,000 progeny will show recombination between two markers that are 0.02 map units apart, and obviously one has to examine at least 10,000 progeny to reliably score this recombination. That's the power of microbial genetics ‑ you actually can select or screen through this many progeny, sometimes quite easily.
An example of recombination in phage is shown in Fig. 1.14. Wild type T2 phage forms small plaques and kills only E. coli strain B. Thus different alleles of h can be distinguished by plating on a mixture of E. coli strains B and B/2. The phage carrying mutant h allele will generate clear plaques, since they kill both strains. Phage with the wild type h+ give turbid plaques, since the B/2 cells are not lysed but B cells are. When a mixture of E. coli strains B and B/2 are co-infected with both T2 hr and T2 h+r+, four types of plaques are obtained. Most have the parental phenotypes, clear and large or turbid and small. These plaques contain progeny phage that retain the parental genotypes T2 hr and T2 h+r+, respectively. The other two phenotypes are nonparental, i.e. clear and small or turbid and large. These are from progeny with recombinant genotypes, i.e. T2 hr+ and T2 h+r. In this mixed infection, recombination occurred between two phage genomes in the same cell.
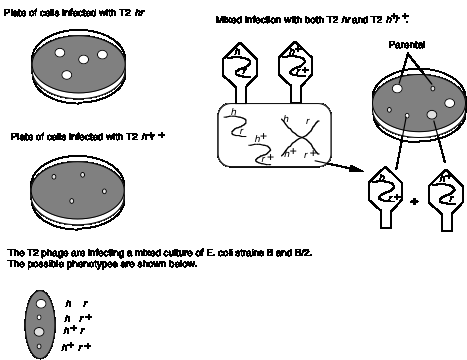
Figure 1.14. Recombination in bacteriophage
The first demonstration of recombination within a gene came from work on the rIIA and rIIB genes of phage T4. These experiments from Seymour Benzer, published in 1955, used techniques like that diagrammed in Fig. 1.14. Remember that mutations in the r gene cause rapid lysis of infected cells, i.e. the length of the lytic cycle is shorter. The difference in plaque morphology between r and r+ phage is easy to see (large versus small, respectively). These two genes are very close together, and many mutations were independently isolated in each. This was summarized in the discussion on complementation above.
Consider the results of infection of a bacterial culture with two mutant alleles of gene rIIA.
T4rIIA6 _|_______________________x______|_
and T4rIIA27 _|_______x______________________|_
(x marks the position of the mutation in each allele).
Progeny phage from this infection include those with a parental genotype (in the great majority), and at a much lower frequency, two types of recombinants:
wild type T4 r+ _|______________________________|_
double mutant T4rIIA6 rIIA27 _|_______x_______________x______|_
The wild type is easily scored because it, and not any rII mutants, will grow on E. coli strain K12(l), whereas both wild type and mutant phage grow equally well on E. coli strain B. Thus you can select for the wild type (and you will see only the desired recombinant). Finding the double mutants is more laborious, because they are obtained only by screening through the progeny, testing for phage that when backcrossed with the parental phage result in no wild type recombinant progeny.
Equal numbers of wild type and double mutant recombinants were obtained, showing that recombination can occur within a gene, and that this occurs by reciprocal crossing over. If recombination were only between genes, then no wild type phage would result. A large spectrum of recombination values was obtained in crosses for different alleles, just like you obtain for crosses between mutants in separate genes.
Several major conclusions could be made as a result of these experiments on recombination within the rII genes.
(1) A large number of mutable sites occur within a gene, exceeding some 500 for the rIIA and rIIB genes. We now realize that these correspond to the individual base pairs within the gene.
(2) The genetic maps are clearly linear, indicating that the gene is linear. Now we know a gene is a linear polymer of nucleotides.
(3) Most mutations are changes at one mutable site (point mutations). Many genes can be restored to wild type by undergoing a reverse mutation at the same site (reversion).
(4) Other mutations cause the deletion of one or more mutable sites, reflecting a physical loss of part of the rII gene. Deletions of one or more mutable site (base pair) are extremely unlikely to revert back to the original wild type.
One gene encodes one polypeptide
One of the fundamental insights into how genes function is that one gene encodes one enzyme (or more precisely, one polypeptide). Beadle and Tatum reached this conclusion based on their complementation analysis of the genes required for arginine biosynthesis in fungi. They showed that a mutation in each gene led to a loss of activity of one enzyme in the multistep pathway of arginine biosynthesis. As discussed above in the section on genetic dissection, a large number of Arg auxotrophs (requiring Arg for growth) were isolated, and then organized into a set of complementation groups, where each complementation groups represents a gene.
The classic work of Beadle and Tatum demonstrated a direct relationship between the genes defined by the auxotrophic mutants and the enzymes required for Arg biosynthesis. They showed that a mutation in one gene resulted in the loss of one particular enzymatic activity, e.g. in the generalized scheme below, a mutation in gene 2 led to a loss of activity of enzyme 2. This led to an accumulation of the substrate for that reaction (intermediate N in the diagram below). If there were 4 complementation groups for the Arg auxotrophs, i.e. 4 genes, then 4 enzymes were found in the pathway for Arg biosynthesis. Each enzyme was affected by mutations in one of the complementation groups.
Intermediates:
M ® N ® O ® P ® Arg
enzyme 1 enzyme 2 enzyme 3 enzyme 4
Figure 1.15. A general
scheme showing the relationships among metabolic intermediates (M, N, O, P),
and end product (Arg), enzymes and the genes that encode them.
In general, each step in a metabolic pathway is catalyzed by an enzyme (identified biochemically) that is the product of a particular gene (identified by mutants unable to synthesize the end product, or unable to break down the starting compound, of a pathway). The number of genes that can generate auxotrophic mutants is (usually) the same as the number of enzymatic steps in the pathway. Auxotrophic mutants in a given gene are missing the corresponding enzyme. Thus Beadle and Tatum concluded that one gene encodes one enzyme. Sometimes more than one gene is required to encode an enzyme because the enzyme has multiple, different polypeptide subunits. Thus each polypeptide is encoded by a gene.
The metabolic intermediates that accumulate in each mutant can be used to place the enzymes in their order of action in a pathway. In the diagram in Fig. 1.15, mutants in gene 3 accumulated substance O. Feeding substance O to mutants in gene 1 or in gene 2 allows growth in the absence of Arg. We conclude that the defects in enzyme 1 or enzyme 2, respectively, are upstream of enzyme 3. In contrast, feeding substance O to mutants in gene 4 will not allow growth in the absence of Arg. Even though this mutant can convert substance O to substance P, it does not have an active enzyme 4 to convert P to Arg. The inability of mutants in gene 4 to grow on substance O shows that enzyme 4 is downstream of enzyme 3.
Question 1.4. Imagine that you are studying serine biosynthesis in a fungus. You isolate serine auxotrophs, do all the pairwise crosses of the mutants and discover that the auxotrophs can be grouped into three complementation groups, called A, B and C. You also discover that a different metabolic intermediate accumulates in members of each complementation group - substance A in auxotrophs in the A complementation group, substance B in the B complementation group and substance C in the C complementation group. Each of the intermediates is fed to auxotrophs from each of the three complementation groups as tabulated below. A + means that the auxotroph was able to grow in media in the absence of serine when fed the indicated substance; a - denotes no growth in the absence of serine.
|
Fed: |
mutant in complementation group A |
mutant in complementation group B |
mutant in complementation group C |
|
substance A |
- |
+ |
+ |
|
substance B |
- |
- |
- |
|
substance C |
- |
+ |
- |
In the biosynthetic pathway to serine in this fungus, what is the order of the enzymes encoded in the three complementation groups? Enzyme A is encoded by the gene that when altered generates mutants that fall into complementation group A, etc.
The gene and its polypeptide product are
colinear
Once it was determined that a gene was a linear array of mutable sites, that genes are composed of a string of nucleotides called DNA (see Chapter 2), and that each gene encoded a polypeptide, the issue remained to be determined how exactly that string of nucleotides coded for a particular amino acid sequence. This problem was studied along several avenues, culminating in a major achievement of the last half of the 20th century – the deciphering of the genetic code. The detailed assignment of particular codons (triplets of adjacent nucleotides) will be discussed in Chapter 13. In the next few sections of this chapter, we will examine how some of the basic features of the genetic code were deciphered.
A priori, the coding units within a gene could encode both the composition and the address for each amino acid, as illustrated in Model 1 of Fig. 1.17. In this model, the coding units could be scrambled and still specify the same protein. In such a situation, the polypeptide would not be colinear with the gene.

Figure 1.16. Alternative models for gene and codon structure.
In an alternative model (Model 2 in Fig. 1.16), the coding units only specify the composition, but not the position, of an amino acid. The "address" of the amino acid is derived from the position of the coding unit within the gene. This model would predict that the gene and its polypeptide product would be colinear - e.g. mutation in the 5th coding unit would affect the 5th amino acid of the protein, etc.
Charles Yanofsky and his co-workers (1964) tested these two models and determined that the gene and the polypeptide product are indeed colinear. They used recombination frequencies to map the positions of different mutant alleles in the gene that encodes a particular subunit of the enzyme tryptophan synthase. They then determined the amino acid sequence of the wild type and mutant polypeptides. As illustrated in Fig. 1.17, the position of a mutant allele on the recombination map of the gene corresponds with the position of the amino acid altered in the mutant polypeptide product. For instance, allele A101 maps to one end of the gene, and the corresponding Glu ® Val replacement is close to the N terminus of the polypeptide. Allele A64 maps close to the other end of the gene, and the corresponding Ser ® Leu replacement is close to the C terminus of the polypeptide. This correspondence between the positions of the mutations in each allele and the positions of the consequent changes in the polypeptide show that Model 1 can be eliminated and Model 2 is supported.
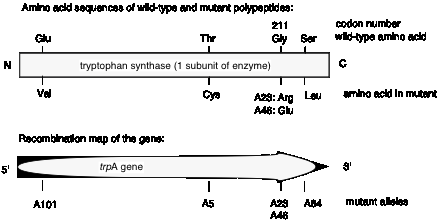
Figure 1.17. The polypeptide is colinear with the gene.
Mutable sites are base pairs along the double
helix
The large number of mutable sites found in each gene, and between which recombination can occur, leads one to conclude that the mutable sites are base pairs along the DNA. Sequence determination of the wild type and mutant genes confirms this conclusion.
Single amino acids are specified by three
adjacent nucleotides, which are a codons
This conclusion requires three pieces of information.
First of all, adjacent mutable sites specify amino acids. Reaching this conclusion required investigation of the fine structure of a gene, including rare recombination between very closely linked mutations within a gene. Yanofsky and his colleagues, working with mutations the trpA gene of E. coli, encoding tryptophan synthase, showed that different alleles mutated in the same codon could recombine (albeit at very low frequency). (This is the same laboratory and same system that was used to show that a gene and its polypeptide product are colinear.) Thus recombination between two different alleles can occur within a codon, which means that a codon must have more than one mutable site. We now recognize that a mutable site is a nucleotide in the DNA. Thus adjacent mutable sites (nucleotides) encode a single amino acid.
Let’s look at this in more detail (Fig. 1.18). Yanofsky and colleagues examined two different mutant alleles of trpA, each of which caused alteration in amino acid 211 of tryptophan synthase. In the mutant allele A23, wild type Gly is converted to mutant Arg. In the mutant allele A46, wild type Gly is converted to mutant Glu.
GGA (Gly 211) --> AGA (Arg 211) mutant allele A23
GGA (Gly 211) --> GAA (Glu 211) mutant allele A46
A23 ´ A46 AGA ´ GAA ® GGA (wild type Gly 211 in 2 out of 100,000 progeny)
Figure 1.18. Recombination can occur between two mutant alleles affecting the same codon.
Alleles A23 and A46 are not alternative forms of the same mutable site, because recombination to yield wild type occurs, albeit at a very low frequency (0.002%; the sites are very close together, in fact in the same codon!). If they involved the same mutable site, one would never see the wild-type recombinant.
The second observation is that the genetic code is non-overlapping. This was shown by demonstrating that a mutation at a single site alters only one amino acid. This conflicts with the predictions of an overlapping code (see Fig. 1.19), and thus the code must be non-overlapping.

Figure 1.19. Predictions of the effects of nucleotide substitutions, insertions or deletions on polypeptides encoded by an overlapping, a punctuated, or a nonoverlapping, nonpunctuated code.
The third observation is that the genetic code is read in triplets from a fixed starting point. This was shown by examining the effect of frameshift mutations. As shown in Fig. 1.19, a code lacking punctuation has a certain reading frame. Insertions or deletions of nucleotides are predicted to have a drastic effect on the encoded protein because they will change that reading frame. The fact that this was observed was one of the major reasons to conclude that the mRNA molecules encoded by genes are read in successive blocks of three nucleotides in a particular reading frame.
For the sequence shown in Fig. 1.20, insertion of an A shifts the reading frame, so all amino acids after the insertion differ from the wild type sequence. (The 4th amino acid is still a Gly because of degeneracy in the code: both GGC and GGG code for Gly.) Similarly, deletion of a U alters the entire sequence after the deletion.

Figure 1.20. Frameshift mutations show that the genetic code is read in triplets.
These observations show that the nucleotide sequence is read, or translated, from a fixed starting point without punctuation. An alternative model is that the group of nucleotides encoding an amino acid (the codon) could also include a signal for the end of the codon (Model 2 in Fig. 1.19). This could be considered a "comma" at the end of each codon. If that were the case, insertions or deletions would only affect the codon in which they occur. However, the data show that all codons, including and after the one containing the insertion or deletion, are altered. Thus the genetic code is not punctuated, but is read in a particular frame that is defined by a fixed starting point (Model 3 in Fig. 1.19). That starting point is a particular AUG, encoding methionine. (More about this will be covered in Chapter 13).
The results of frame-shift mutations are so drastic that the proteins are usually not functional. Hence a screen or selection for loss-of-function mutants frequently reveals these frameshift mutants. Simple nucleotide substitutions that lead to amino acid replacements often have very little effect on the protein, and hence have little, or subtle, phenotypes.
A double mutant generated by crossing over between the insertion (+) and deletion (‑) results in an (almost) normal phenotype, i.e. reversion of insertion or deletion.
A gene containing three closely spaced insertions (or deletions) of single nucleotides will produce a functional product. However, four or five insertions or deletions do not give a functional product (Crick, Barnett, Brenner and Watts‑Tobin, 1961). This provided the best evidence that the genetic code is read in groups of three nucleotides (not two or four). Over the next 5 years the code was worked out (by 1966) and this inference was confirmed definitively.
Central Dogma: DNA to RNA to protein
A few years after he and James Watson had proposed the double helical structure for DNA, Francis Crick (with other collaborators) proposed that a less stable nucleic acid, RNA, served as a messenger RNA that provided a transient copy of the genetic material that could be translated into the protein product encoded by the gene. Such mRNAs were indeed found. These and other studies led Francis Crick to formulate this “central dogma” of molecular biology (Fig. 1.21).
This model states that DNA serves as the repository of genetic information. It can be replicated accurately and indefinitely.
The genetic information is expressed by the DNA first serving as a template for the synthesis of (messenger) RNA; this occurs in a process called transcription. The mRNA then serves as a template, which is read by ribosomes and translated into protein. The protein products can be enzymes that catalyze the many metabolic transformations in the cell, or they can be structural proteins.

Figure 1.21. The central dogma of molecular biology.
Although there have been some additional steps added since its formulation, the central dogma has stood the test of time and myriad experiments. It provides a strong unifying theme to molecular genetics and information flow in cell biology and biochemistry.
Although in many cases a gene encodes one polypeptide, other genes encode a functional RNA. Some genes encode tRNAs and rRNAs needed for translation, others encode other structural and catalytic RNAs. Genes encode some product that is used in the cell, i.e. that when altered generates an identifiable phenotype. More generally, genes encode RNAs, some of which are functional as transcribed (or with minor alterations via processing) such as tRNAs and rRNAs, and others are messengers that are then translated into proteins. These proteins can provide structural, catalytic and regulatory roles in the cell.
Note the static role of DNA in this process. Implicit in this model is the idea that DNA does not provide an active cellular function, but rather it encodes macromolecules that are functional. However, the expression of virtually all genes is highly regulated. The sites on the DNA where this control is exerted are indeed functional entities, such as promoters and enhancers. In this case, the DNA is directly functional (cis‑regulatory sites), but the genes being regulated by these sites still encode some functional product (RNA or protein).
Studies of retroviruses lead Dulbecco to argue that the flow of information is not unidirectional, but in fact RNA can be converted into DNA (some viral RNA genomes are converted into DNA proviruses integrated into the genome). Subsequently Temin and Baltimore discovered the enzyme that can make a DNA copy of RNA, i.e. reverse transcriptase.
Transcription and mRNA structure
Several aspects of the structure of genes can be illustrated by examining the general features of a bacterial gene as now understood.
A gene is a string of nucleotides in the duplex DNA that encodes a mRNA, which itself codes for protein. Only one strand of the duplex DNA is copied into mRNA (Fig. 1.22). Sometimes genes overlap, and in some of those cases each strand of DNA is copied, but each for a different mRNA. The strand of DNA that reads the same as the sequence of mRNA is the nontemplate strand. The strand that reads as the reverse complement of the mRNA is the template strand.
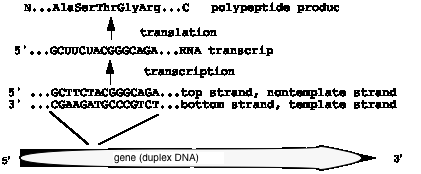
Figure 1.22. Only one strand of duplex DNA codes for a particular product.
NOTE: The term "sense strand" has two opposite uses (unfortunately). Sidney Brenner first used it to designate the strand that served as the template to make RNA (bottom strand above), and this is still used in many genetics texts. However, now many authors use the term to refer to the strand that reads the same as the mRNA (top strand above). The same confusion applies to the term "coding strand" which can refer to the strand encoding mRNA (bottom strand) or the strand "encoding" the protein (top strand). Interestingly, "antisense" is used exclusively to refer to the strand that is the reverse complement of the mRNA (bottom strand).
Figure 1.22 helps illustrate the origin of terms used in gene expression. Copying the information of DNA into RNA stays in the same "language" in that both of these polymers are nucleic acids, hence the process is called transcription. An analogy would be writing exercises where you had to copy, e.g. a poem, from a book onto your paper - you transcribed the poem, but it is still in English. Converting the information from RNA into DNA is equivalent to converting from one "language" to another, in this case from one type of polymer (the nucleic acid RNA) to a different one (a polypeptide or protein). Hence the process is called translation. This is analogous to translating a poem written in French into English.
Fig. 1.23 illustrates the point that a gene may be longer than the region coding for the protein because of 5' and/or 3' untranslated regions.
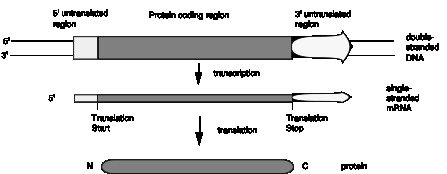
Figure 1.23. Genes and mRNA have untranslated sequences at both the 5’ and 3’ ends.
Eukaryotic mRNAs have covalent attachment of nucleotides at the 5' and 3' ends, and in some cases nucleotides are added internally (a process called RNA editing). Recent work shows that additional nucleotides are added post‑transcriptionally to some bacterial mRNAs as well.
Regulatory signals can be considered parts
of genes
In order to express a gene at the correct time, the DNA also carries signals to start transcription (e.g. promoters), signals for regulating the efficiency of starting transcription (e.g. operators, enhancers or silencers), and signals to stop transcription (e.g. terminators). Minimally, a gene includes the transcription unit, which is the segment of DNA that is copied into RNA in the primary transcript. The signals directing RNA polymerase to start at the correct site, and other DNA segments that influence the efficiency of this process are regulatory elements for the gene. One can also consider them to be part of the gene, along with the transcription unit.
A contemporary problem - finding the
function of genes
Genes were originally detected by the heritable phenotype generated by their mutant alleles, such as the white eyes in the normally red-eyed Drosophila or the sickle cell form of hemoglobin (HbS) in humans. Now that we have the ability to isolate virtually any, and perhaps all, segments of DNA from the genome of an organism, the issue arises as to which of those segments are genes, and what is the function of those genes. (The genome is all the DNA in the chromosomes of an organism.) Earlier geneticists knew what the function of the genes were that they were studying (at least in terms of some macroscopic phenotype), even when they had no idea what the nature of the genetic material was. Now molecular biologists are confronted with the opposite problem - we can find and study lots of DNA, but which regions are functions? Many computational approaches are being developed to guide in this analysis, but eventually we come back to that classical definition, i.e. that appropriate mutations in any functional gene should generate a detectable phenotype. The approach of biochemically making mutations in DNA in the laboratory and then testing for the effects in living cells or whole organisms is called "reverse genetics."
Additional Readings
Griffiths, A. J. F., Miller, J. H., Suzuki, D. T., Lewontin, R. C. and Gelbart, W. M. (1993) An Introduction to Genetic Analysis, Fifth Edition (W. H. Freeman and Company, New York).
Cairns, J., Stent, G. S. and Watson, J. D., editors (1992) Phage and the Origins of Molecular Biology, Expanded Edition (Cold Spring Harbor Laboratory Press, Plainview, NY).
Brock, T. D. (1990) The Emergence of Bacterial Genetics (Cold Spring Harbor Laboratory Press, Plainview, NY).
Benzer, S. (1955) Fine structure of a genetic region in bacteriophage. Proceedings of the National Academy of Sciences, USA 47: 344-354.
Yanofsky, C. (1963) Amino acid replacements associated with mutation and recombination in the A gene and their relationship to in vitro coding data. Cold Spring Harbor Symposia on Quantitative Biology 18: 133-134.
Crick, F. (1970) Central dogma of molecular biology. Nature 227:561-563
Questions
for CHAPTER 1
FUNDAMENTAL
PROPERTIES OF GENES
Question 1.5. Calculating recombination frequencies:
Corn kernels can be colored or white, determined by the alleles C (colored, which is dominant) or c (white, which is recessive) of the colored gene. Likewise, alleles of the shrunken gene determine whether the kernels are nonshrunken (Sh, dominant) or shrunken (sh, recessive). The geneticist Hutchison crossed a homozygous colored shrunken strain (CC shsh) to a homozygous white nonshrunken strain (cc ShSh) and obtained the heterozygous colored nonshrunken F1. The F1 was backcrossed to a homozygous recessive white shrunken strain (cc shsh). Four phenotypes were observed in the F2 progeny, in the numbers shown below.
Phenotype Number of plants
colored shrunken 21,379
white nonshrunken 21,096
colored nonshrunken 638
white shrunken 672
a) What are the predicted frequencies of these phenotypes if the colored and shrunken genes are not linked?
b) Are these genes linked, and if so, what is the recombination frequency between them?
Question 1.6. Constructing a linkage map:
Consider three genes, A, B and C, that are located on the same chromosome. The arrangement of the three genes can be determined by a series of three crosses, each following two of the genes (referred to as two-factor crosses). In each cross, a parental strain that is homozygous for the dominant alleles of the two genes (e.g. AB/AB) is crossed with a strain that is homozygous for the recessive alleles of the two genes (e.g. ab/ab), to yield an F1 that is heterozygous for both of the genes (e.g. AB/ab). In this notation, the slash (/) separates the alleles of genes on one chromosome from those on the homologous chromosome. The F1 (AB/ab) contains one chromosome from each parent. It is then backcrossed to a strain that is homozygous for the recessive alleles (ab/ab) so that the fates of the parental chromosomes can be easily followed. Let's say the resulting progeny in the F2 (second) generation showed the parental phenotypes (AB and ab) 70% of the time. That is, 70% of the progeny showed only the dominant characters (AB) or only the recessive characters (ab), which reflect the haploid genotypes AB/ab and ab/ab, respectively, in the F2 progeny. The remaining 30% of the progeny showed recombinant phenotypes (Ab and aB) reflecting the genotypes Ab/ab and aB/ab in the F2 progeny. Similar crosses using F1's from parental AC/AC and ac/ac backcrossed to a homozygous recessive strain (ac/ac) generated recombinant phenotypes Ac and aC in 10% of the progeny. And finally, crosses using F1's from parental BC/BC and bc/bc backcrossed to a homozygous recessive strain (bc/bc) generated recombinant phenotypes Bc and bC in 25% of the progeny.
a. What accounts for the appearance of the recombinant phenotypes in the F2 progeny?
b. Which genes are closer to each other and which ones are further away?
c. What is a linkage map that is consistent with the data given?
Question 1.7. Why are the distances in the previous problem not exactly additive, e.g. why is the distance between the outside markers (A and B) not 35 map units (or 35% recombination)? There are several possible explanations, and this problem explores the effects of multiple crossovers. The basic idea is that the further apart two genes are, the more likely that recombination can occur multiple times between them. Of course, two (or any even number of) crossover events between two genes will restore the parental arrangement, whereas three (or any odd number of) crossover events will give a recombinant arrangement, thereby effectively decreasing the observed number of recombinants in the progeny of a cross.
For the case examined in the previous problem, with genes in the order A___C_______B, let the term ab refer to the frequency of recombination between genes A and B, and likewise let ac refer to the frequency of recombination between genes A and C, and cb refer to the frequency of recombination between genes C and B.
a) What is the probability that when recombination occurs in the interval between A and C, an independent recombination event also occurs in the interval between C and B?
b) What is the probability that when recombination occurs in the interval between C and B, an independent recombination event also occurs in the interval between A and C?
c) The two probabilities, or frequencies, in a and b above will effectively lower the actual recombination between the outside markers A and B to that observed in the experiment. What is an equation that expresses this relationship, and does it fit the data in problem 3?
d. What is the better estimate for the distance between genes A and B in the previous problem?
Question 1.8 Complementation and recombination in microbes.
The State College Bar Association has commissioned you to study an organism, Alcophila latrobus, which thrives on Rolling Rock beer and is ruining the local shipments. You find three mutants that have lost the ability to grow on Rolling Rock (RR).
a) Recombination between the mutants can restore the ability to grow on RR. From the following recombination frequencies, construct a linkage map for mutations 1, 2, and 3.
Recombination between Frequency
1- and 2- 0.100
1- and 3- 0.099
2- and 3- 0.001
b) The following diploid constructions were tested for their ability to grow on RR. What do these data tell you about mutations 1, 2, and 3?
Grow on RR?
1) 1- 2+ / 1+ 2- yes
2) 1- 3+ / 1+ 3- yes
3) 2- 3+ / 2+ 3- no
Question 1.9 Using recombination frequencies and complementation to deduce maps and pathways in phage.
A set of four mutant phage that were unable to grow in a particular bacterial host (lets call it restrictive) were isolated; however, both mutant and wild type phage will grow in another, permissive host. To get information about the genes required for growth on the restrictive host, this host was co-infected with pairs of mutant phage, and the number of phage obtained after infection was measured. The top number for each co-infection gives the total number of phage released (grown on the permissive host) and the bottom number gives the number of wild-type recombinant phage (grown on the restrictive host). The wild-type parental phage gives 1010 phage after infecting either host. The limit of detection is 102 phage.
Phenotypes
of phage, problem 1.9:
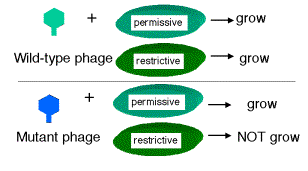
Assays
after co-infection with mutant phage:
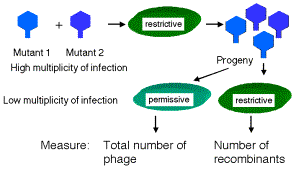
Results of
assays, problem 1.9:
Number of phage
mutant 1 mutant 2 mutant 3 mutant 4
mutant 1 total <102
recombinants <102
mutant 2 total 1010 <102
recombinants 5x10⁶ <102
mutant 3 total 1010 1010 <102
recombinants 107 5x10⁶ <102
mutant 4 total 105 1010 1010 <102
recombinants 105 5x10⁶ 107 <102
a) Which mutants are in the same complementation group? What is the minimum number of genes in the pathway for growth on the restrictive host?
b) Which mutations have the shortest distance between them?
c) Which mutations have the greatest distance between them?
d) Draw a map of the genes in the pathway required for growth on the restrictive host. Show the positions of the genes, the positions of the mutations and the relative distances between them.
Question 1.10. One of the classic experiments in bacterial genetics is the fluctuation analysis of Luria and Delbrück (1943, Mutations of bacteria from virus sensitivity to virus resistance, Genetics 28: 491-511). These authors wanted to determine whether mutations arose spontaneously while bacteria grew in culture, or if the mutations were induced by the conditions used to select for them. They knew that bacteria resistant to phage infection could be isolated from infected cultures. When a bacterial culture is infected with a lytic phage, initially it “clears” because virtually all the cells are lysed, but after several hours phage-resistant bacteria will start to grow.
Luria and Delbrück realized that the two hypothesis for the source of the mutations could be distinguished by a quantitative analysis of the number of the phage-resistant bacteria found in many infected cultures. The experimental approach is outlined in the figure below. Many cultures of bacteria are grown, then infected with a dose of phage T1 that is sufficient to kill all the cells, except those that have acquired resistance. These resistant bacteria grow into colonies on plates and can be counted.
a. What are the predictions for the distribution of the number of resistant bacteria in the two models? Assume that on average, about 1 in 107 bacteria are resistant to infection by phage T1.
b. What do results like those in the figure and table tell you about which model is correct?
Figure for question 1.10.
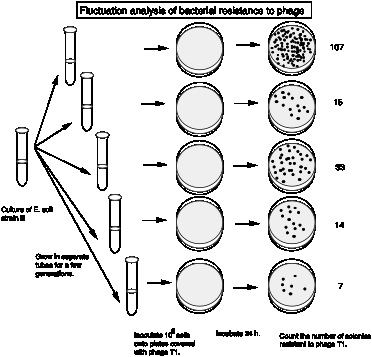
The actual results from Luria and Delbrück are summarized in the following table. They examined 87 cultures, each with 0.2 ml of bacteria, for phage resistant colonies.
|
Number of resistant bacteria |
Number of cultures |
|
0 |
29 |
|
1 |
17 |
|
2 |
4 |
|
3 |
3 |
|
4 |
3 |
|
5 |
2 |
|
6-10 |
5 |
|
11-20 |
6 |
|
21-50 |
7 |
|
51-100 |
5 |
|
101-200 |
2 |
|
201-500 |
4 |
|
501-1000 |
0 |
Interested students may wish to read about the re-examination of the origin of mutations by Cairns, Overbaugh and Miller (1988, The origin of mutants. Nature 335:142-145). Using a non-lethal selective agent (lactose), they obtained results indicating both pre-adaptive (spontaneous) mutations as well as some apparently induced by the selective agent.